Dallas-Fort Worth Economic Indicators

| DFW economy dashboard (April 2023) | |||
| Job growth (annualized) Jan.–April '23 |
Unemployment rate |
Avg. hourly earnings |
Avg. hourly earnings growth y/y |
| 2.4% | 3.7% | $34.50 | 4.3% |
Expansion continued in the DFW economy in April. Employment growth was strong, and the Dallas and Fort Worth business-cycle indexes rose. Worker Adjustment and Retraining Notification (WARN) data suggest that layoffs have picked up from 2022. Home prices dipped in March. DFW population growth increased in 2022.
Labor market
Job growth still solid
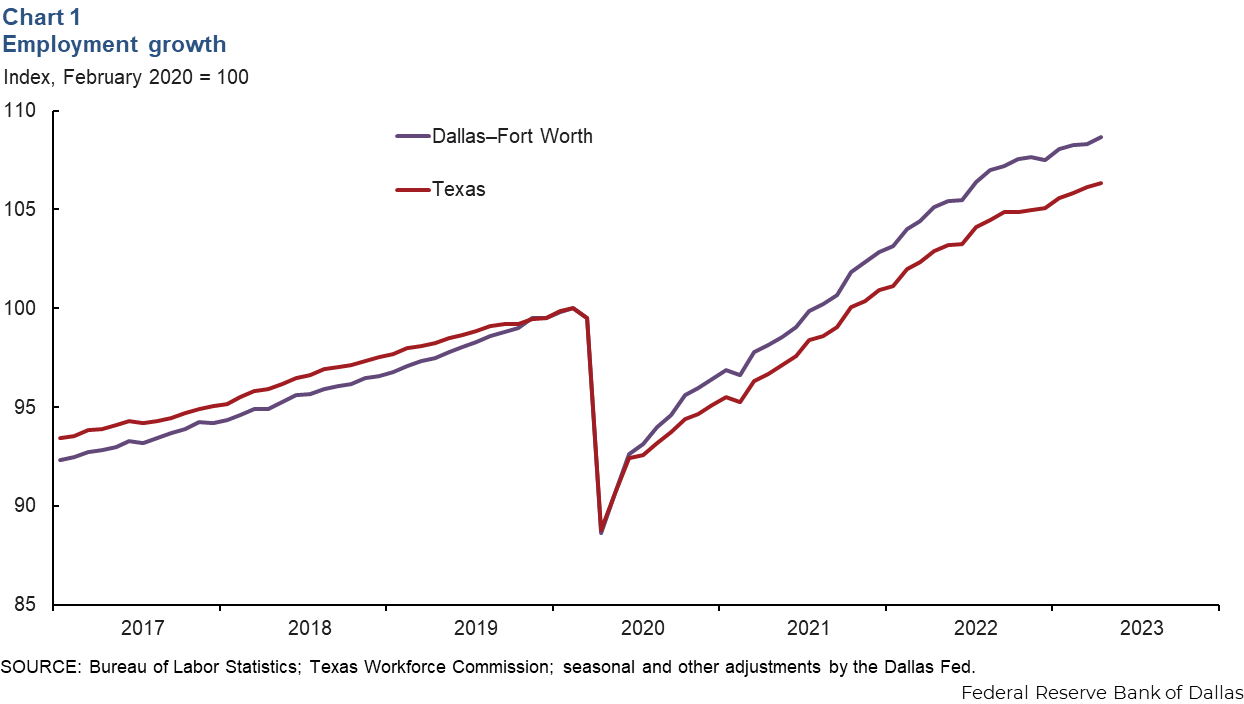
DFW payroll employment grew an annualized 3.9 percent (13,400 jobs) in April (Chart 1). In the three months through April, employment was up an annualized 2.4 percent in DFW, in line with its trend growth rate. Job gains were mostly broad based across sectors during this period, though payrolls in manufacturing contracted, and growth was sluggish in financial activities (1.3 percent) and leisure and hospitality (1.4 percent). Texas payrolls rose an annualized 3.0 percent in the three months ending in April. The DFW unemployment rate was unchanged at 3.7 percent in April and was below the jobless rate in the state.
Layoffs tick up
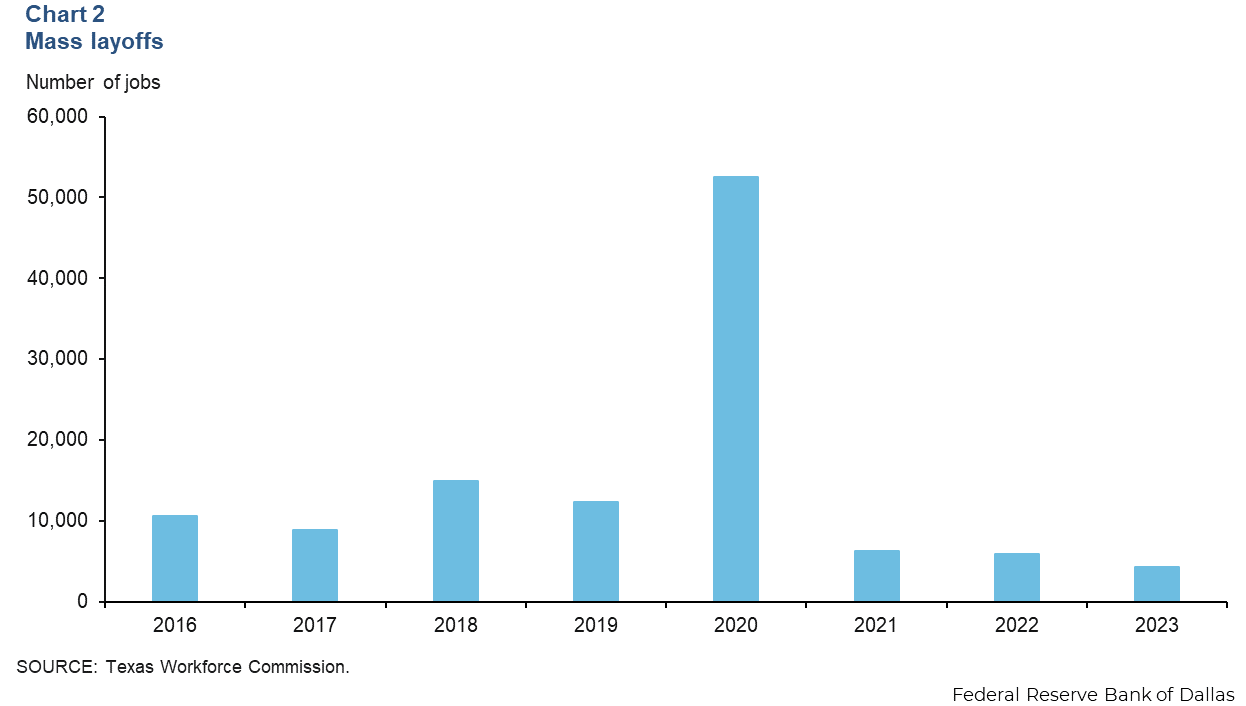
WARN data available through mid-May showed that layoff notices were filed for 4,257 positions in DFW (Chart 2). This compares with 5,953 layoffs in all of 2022. At the current pace, layoffs in 2023 will likely exceed last year’s levels. The layoff announcements so far this year have been widespread across sectors, though they are concentrated in finance and insurance, retail and professional, scientific and technical services. Layoffs in the professional, scientific and technical sectors are linked to an abrupt slowing in the high-tech sector after the pandemic-era boom.
Business-cycle indexes
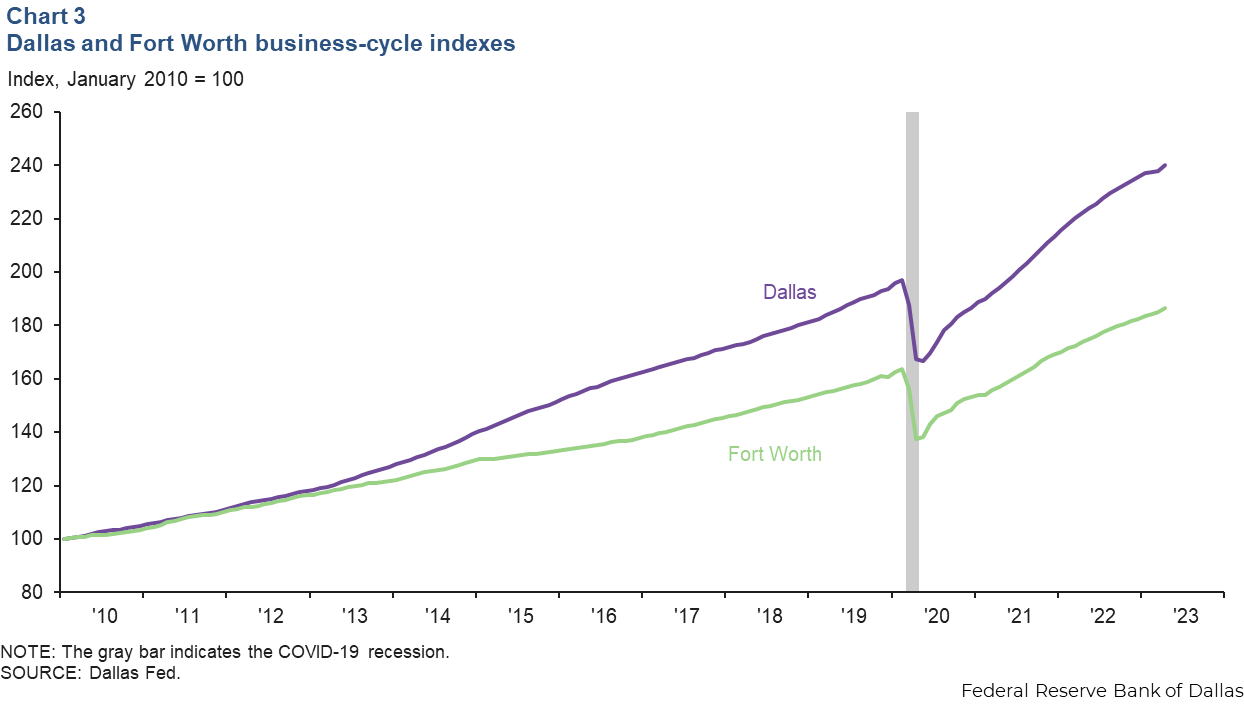
The Dallas and Fort Worth business-cycle indexes continued to expand in April, buoyed by sustained job growth and low unemployment. The Dallas index climbed an annualized 10.8 percent—marking the 35th straight month of growth—and was up 21.9 percent from its prepandemic peak (Chart 3). The Fort Worth index rose an annualized 11.3 percent, 14.0 percent above its prepandemic high.
Home prices
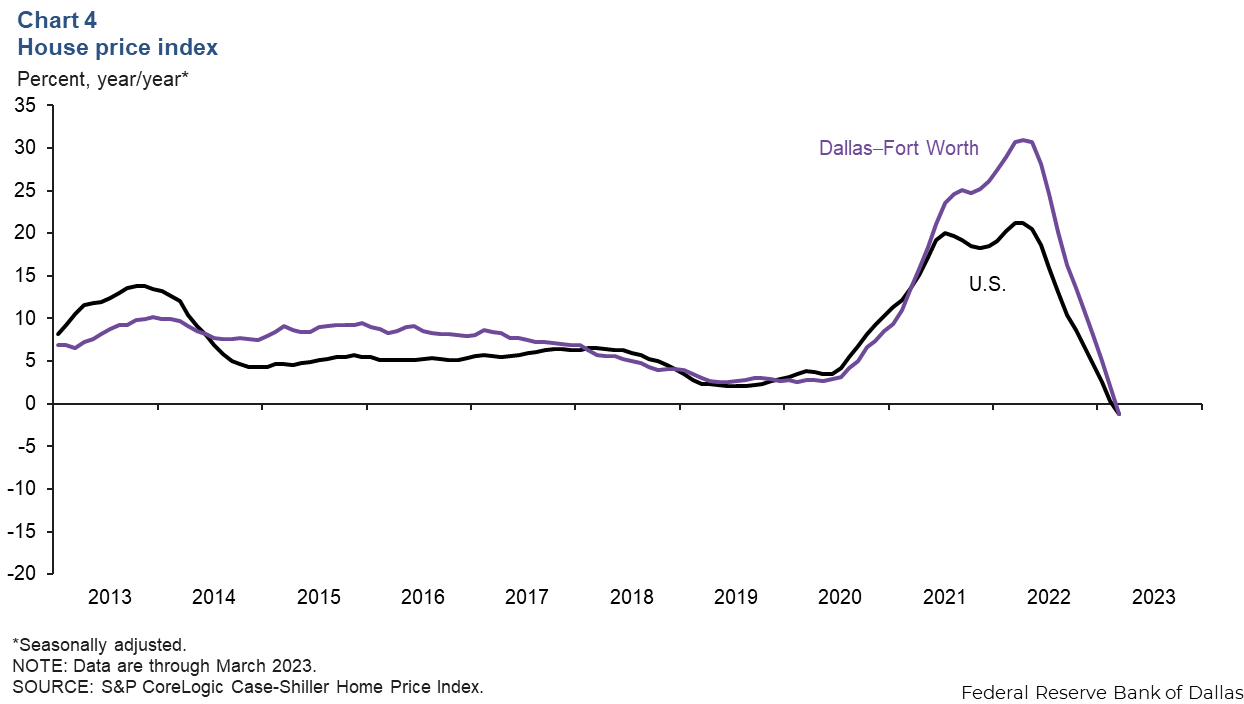
DFW home prices declined for the ninth straight month in March, albeit at a slower pace than February. According to the S&P CoreLogic Case-Shiller index, home prices in Dallas dipped 0.1 percent in March, slower than February’s 0.3 percent decline, and the U.S. 20-city price index rose 0.5 percent. Year over year, home prices are down 1.2 percent in Dallas and nationally (Chart 4). Business contacts noted the housing market has stabilized as home sales have improved and the spring selling season has been decent. Still, sales remained below year-ago levels.
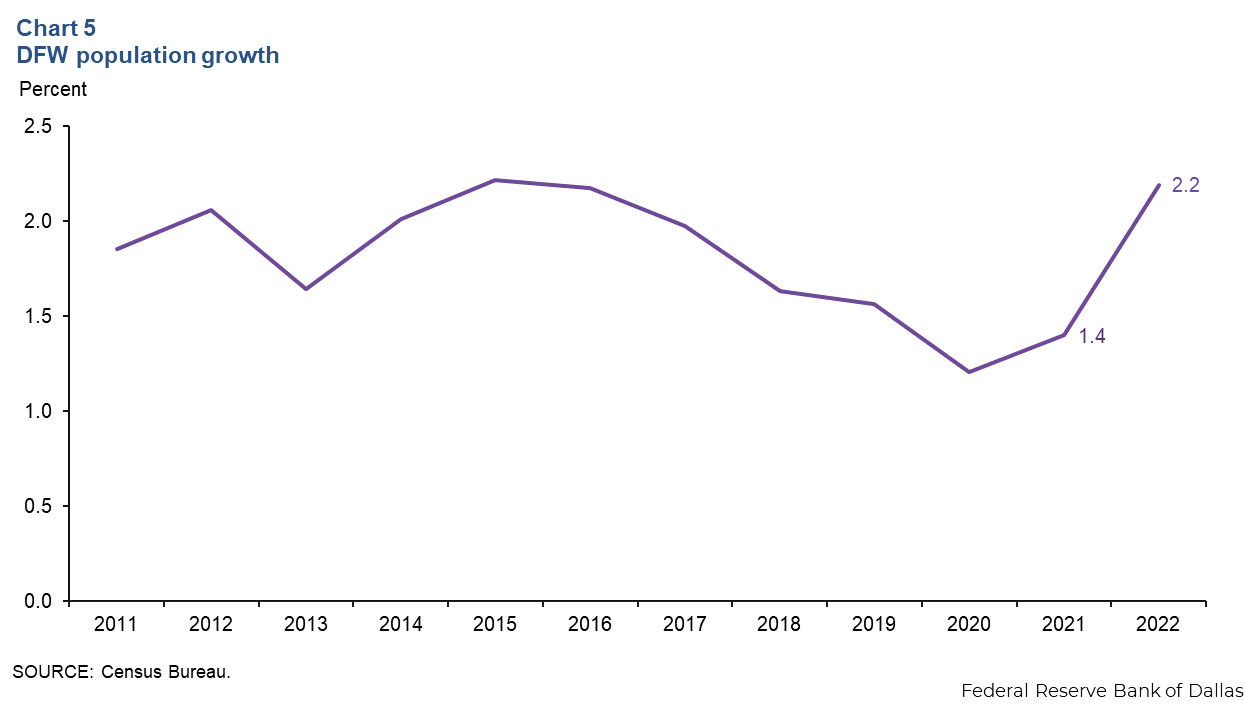
Population
According to recently released census data, DFW’s population increased by 170,400 from July 2021 to July 2022 thanks to continuing in-migration. DFW’s population reached 7.9 million last year, and growth was 2.2 percent in 2022, up from 1.4 percent in 2021 (Chart 5). Growth last year outperformed its long-term average of 1.8 percent, a departure from the previous four years when it had been lower. In Dallas, population growth increased to 2.4 percent from 1.5 percent in 2021, and in Fort Worth, growth picked up to 1.8 percent from 1.2 percent in 2021. Population growth at the state level was 1.6 percent in 2022, up from 2021’s 1.1 percent.
NOTE: Data may not match previously published numbers due to revisions.
About Dallas–Fort Worth Economic Indicators
Questions or suggestions can be addressed to Laila Assanie at laila.assanie@dal.frb.org. Dallas–Fort Worth Economic Indicators is published every month after state and metro employment data are released.