Dallas-Fort Worth Economic Indicators

| DFW economy dashboard (March 2024) | |||
Job growth (annualized)
Dec. '23–March '24 |
Unemployment rate |
Avg. hourly earnings |
Avg. hourly earnings growth y/y |
0.7% |
3.8% | $34.44 | 2.1% |
Dallas–Fort Worth economic growth waned in March. Payroll employment and home sales dipped, while unemployment ticked up. Private hourly earnings edged up. DFW job growth in the first quarter trailed the state and the U.S. Office absorption declined again in the first quarter, pushing up the vacancy rate, while industrial demand remained moderate.
Labor market
Payrolls contract in March
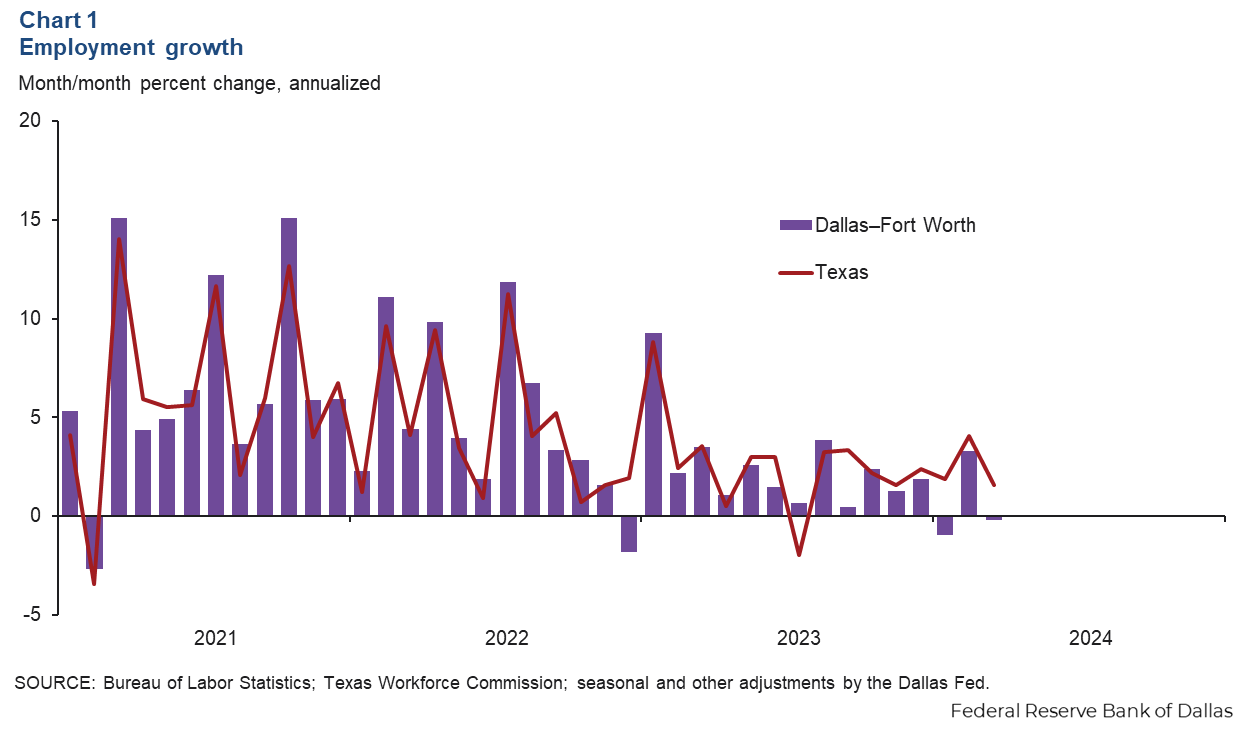
DFW employment contracted an annualized 0.2 percent (-740 jobs nonannualized) in March (Chart 1). Payrolls in Dallas dipped an annualized 0.4 percent (-1,100), while employment in Fort Worth ticked up 0.4 percent (370). Meanwhile, Texas job growth slowed to 1.6 percent in March after growing 4.1 percent in the prior month. The unemployment rate increased to 3.8 percent in DFW, though it remained below Texas’ jobless rate of 3.9 percent, which was unchanged for the 10th straight month.
Employment gains slow in first quarter
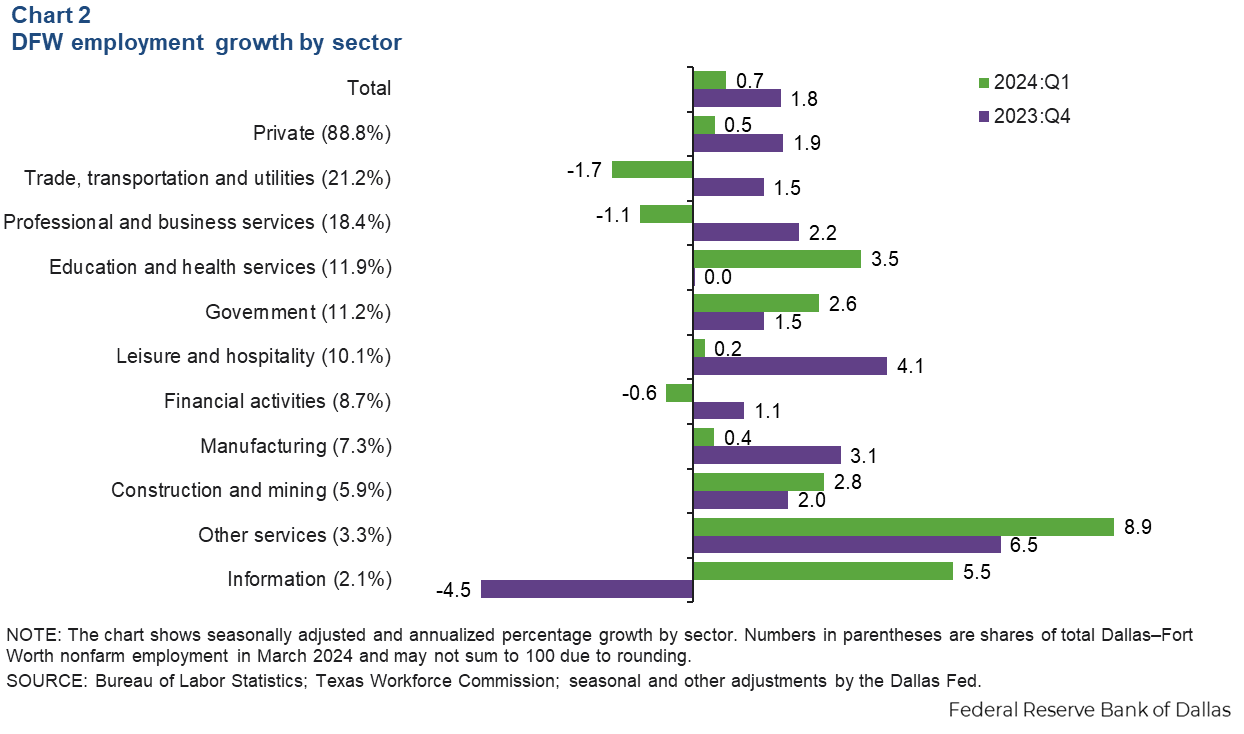
DFW employment grew an annualized 0.7 percent in the first quarter, slower than the fourth quarter’s 1.8 percent increase (Chart 2). DFW gains were mixed across major sectors over the three-month period. Employment gains were robust in information services, education and health services, construction and mining, and other services. Payrolls in leisure and hospitality, which grew robustly in 2023, were nearly flat, while employment contracted in trade, transportation and utilities, professional and business services, and financial activities. First-quarter employment growth in DFW was slower than the state (2.5 percent) and national rates (1.9 percent).
Hourly wages edge up
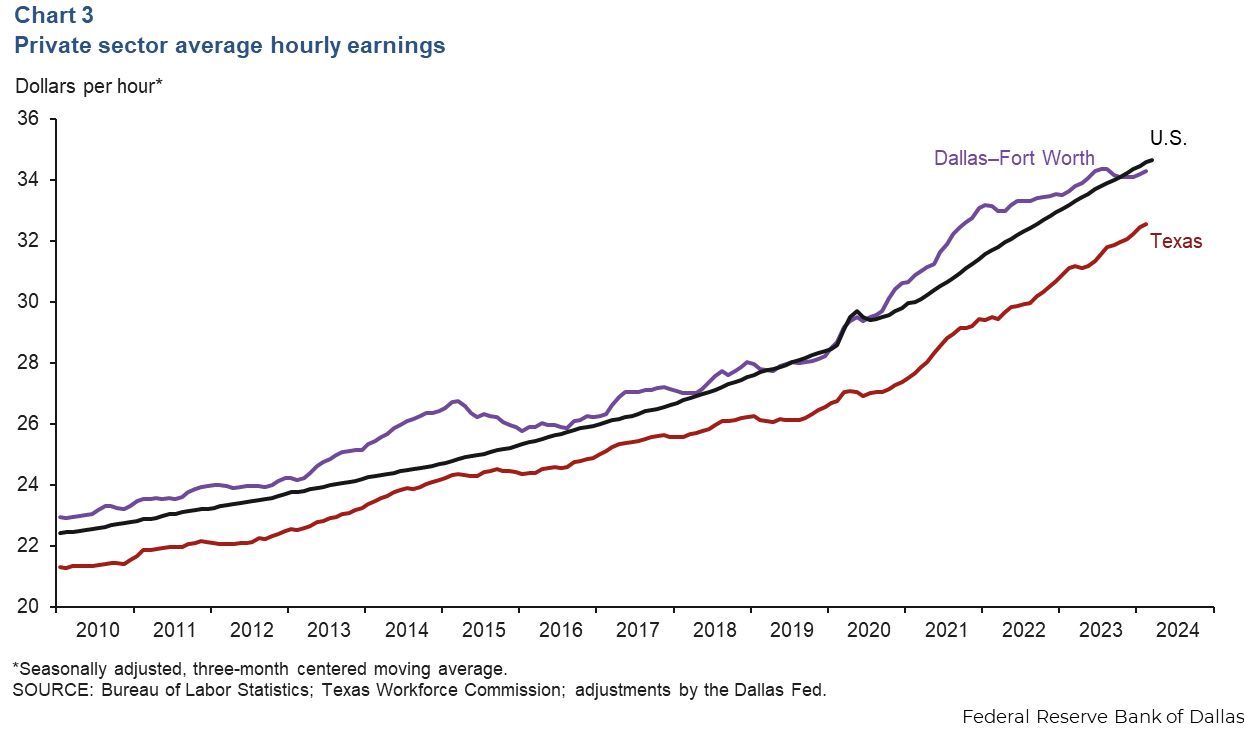
DFW average private hourly earnings ticked up to $34.44 in March, up from February’s figure of $34.11. The three-month moving average for hourly earnings edged up to $34.29. Though the figure remained above the state average of $32.55, it was below the national average of $34.66 (Chart 3). In the past year, average wages in DFW have increased 2.1 percent, narrower than gains of 4.5 percent in Texas and 4.1 percent in the U.S.
Housing
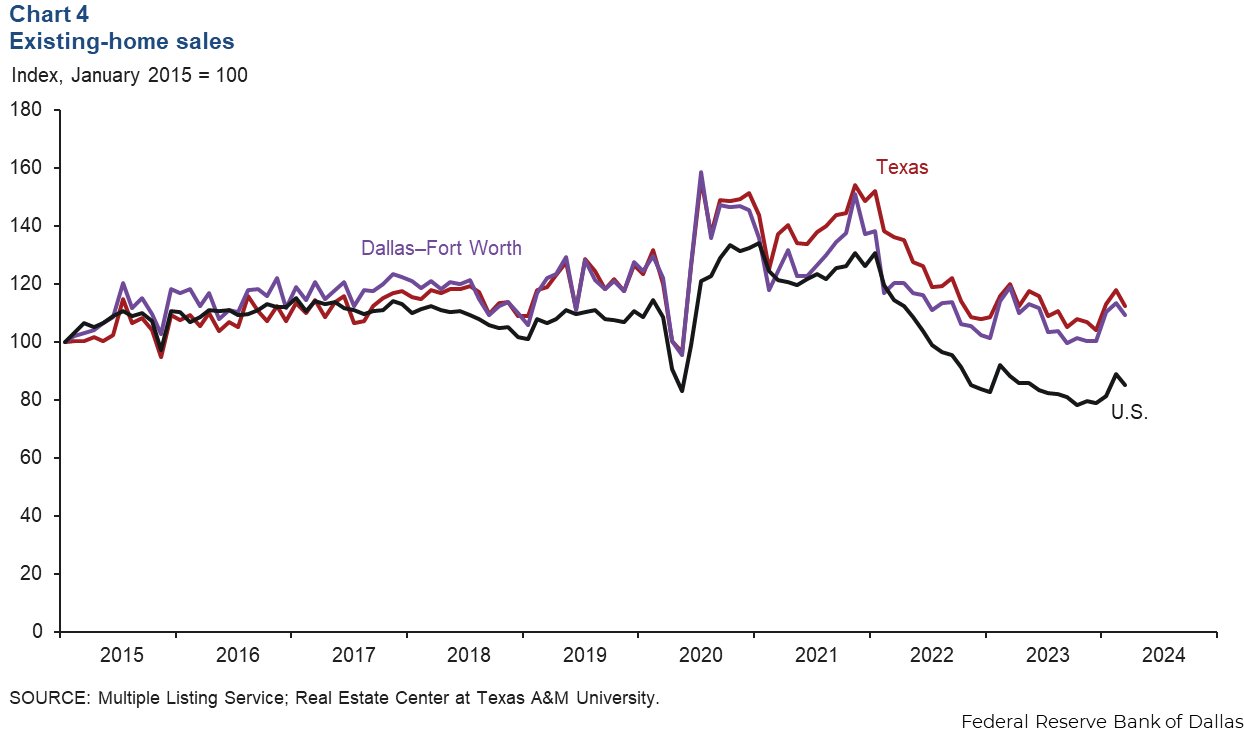
DFW existing-home sales fell 3.5 percent in March following strong growth the previous two months (Chart 4). Statewide, existing-home sales dipped 4.7 percent. According to business contacts, new-home sales were impacted some by higher mortgage rates. Through March, existing-home sales are relatively flat in both DFW and Texas compared with the same period in 2023. DFW and Texas existing-home inventories have been steadily rising and were at 3.4 and 4.2 months of supply in March, respectively.
Commercial real estate
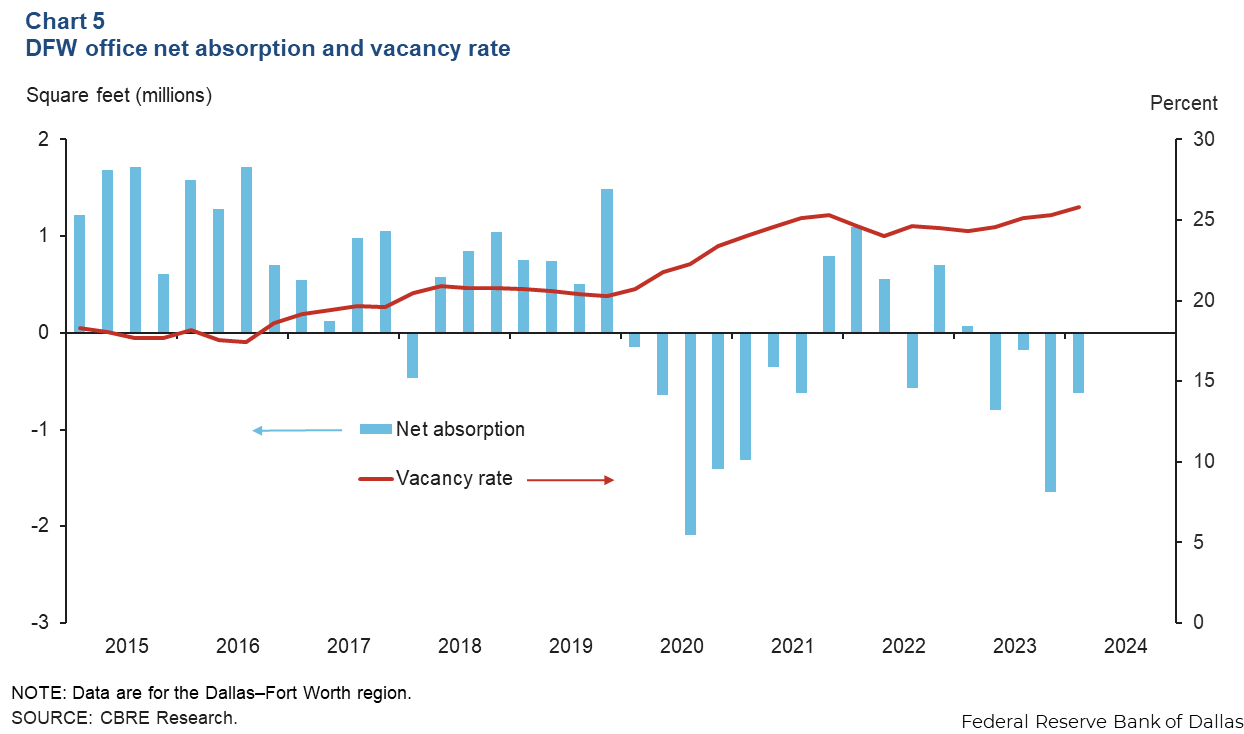
Office vacancy continues to creep up
Demand for office space in DFW remained weak in first quarter 2024 as tenants continued to reevaluate their space needs. Net absorption was negative for the fourth straight quarter at 619,861 square feet, pushing up the vacancy rate to a multiyear high of 25.8 percent, according to data from CBRE Research (Chart 5). The metroplex had 59 million square feet of vacant office space in the first quarter. Availability of sublease space dipped to 9.9 million square feet, with Class A properties accounting for 75 percent of the metro area’s sublease space.
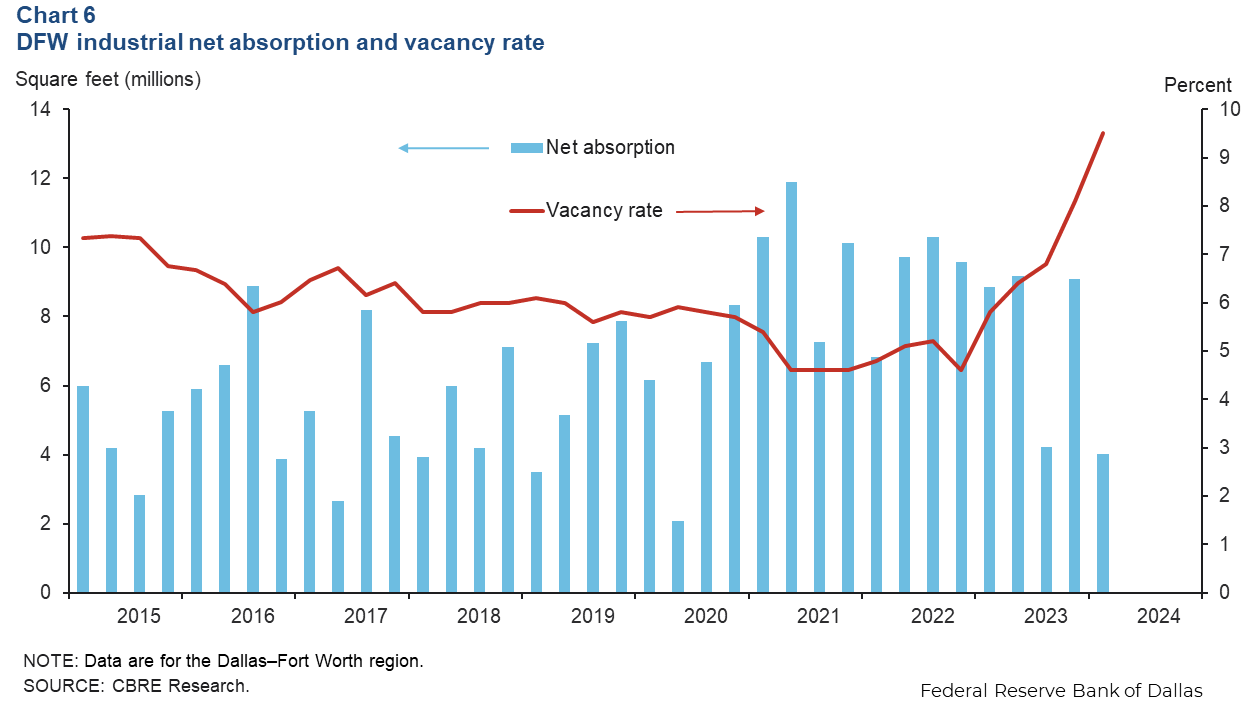
Industrial leasing stays solid, but vacancy climbs further
The positive momentum in industrial leasing continued in the first quarter, driven primarily by demand from manufacturing. Net absorption was 4 million square feet, less than half the space absorbed in the fourth quarter, according to CBRE (Chart 6). The South Dallas and DFW airport submarkets were the most active in terms of leasing demand last quarter. The vacancy rate climbed to 9.5 percent due to the elevated level of deliveries that totaled 14.7 million square feet—nearly twice the amount of leasing activity in the first quarter. Space under construction dropped from 30 million square feet to 18 million square feet.
NOTE: Data may not match previously published numbers due to revisions.
About Dallas–Fort Worth Economic Indicators
Questions or suggestions can be addressed to Laila Assanie at laila.assanie@dal.frb.org. Dallas–Fort Worth Economic Indicators is published every month after state and metro employment data are released.