Dallas−Fort Worth Economic Indicators

| DFW economy dashboard (April 2025) | |||
Job growth (annualized)
Jan.–April '25 |
Unemployment rate |
Avg. hourly earnings |
Avg. hourly earnings growth y/y |
2.1% |
3.9% | $36.60 | 6.5% |
The Dallas−Fort Worth economy expanded in April as employment grew across most sectors. Retail sales tax collections rose, but home sales and home prices fell.
Labor market
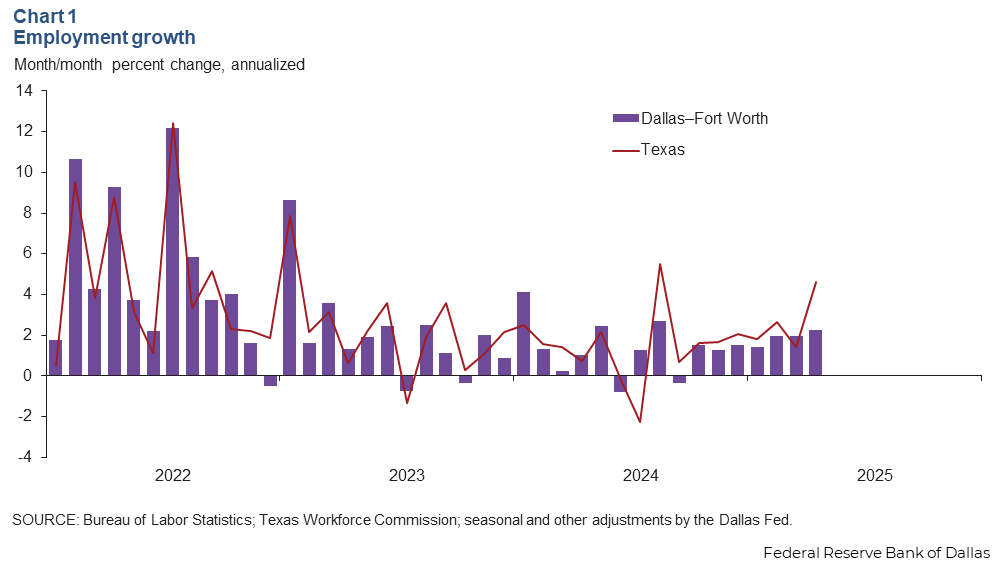
Employment in Dallas−Fort Worth grew 2.3 percent (8,000 jobs) in April after rising 2.0 percent in March (Chart 1). Job growth was mostly broad-based across the major sectors during the three months ending in April, with the strongest gains in the construction and mining, leisure and hospitality, and information sectors. The unemployment rate in the metro area ticked up to 3.9 percent in April. Employment in Texas rose 4.6 percent in April.

Sales tax collections
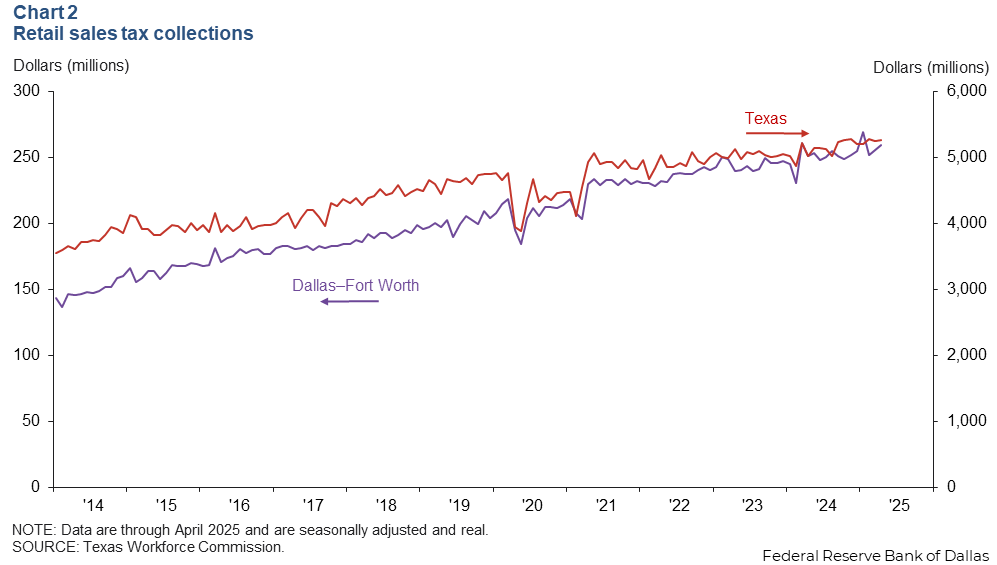
In April, Dallas−Fort Worth sales tax collections rose 1.6 percent to $259 million (Chart 2). Sales tax collections rose 1.2 percent in Dallas, 2.2 percent in Fort Worth and 0.4 percent in Texas. Year over year, sales tax collections were up 3.4 percent in DFW and 5.0 percent statewide.

Housing
Existing-home sales slow further
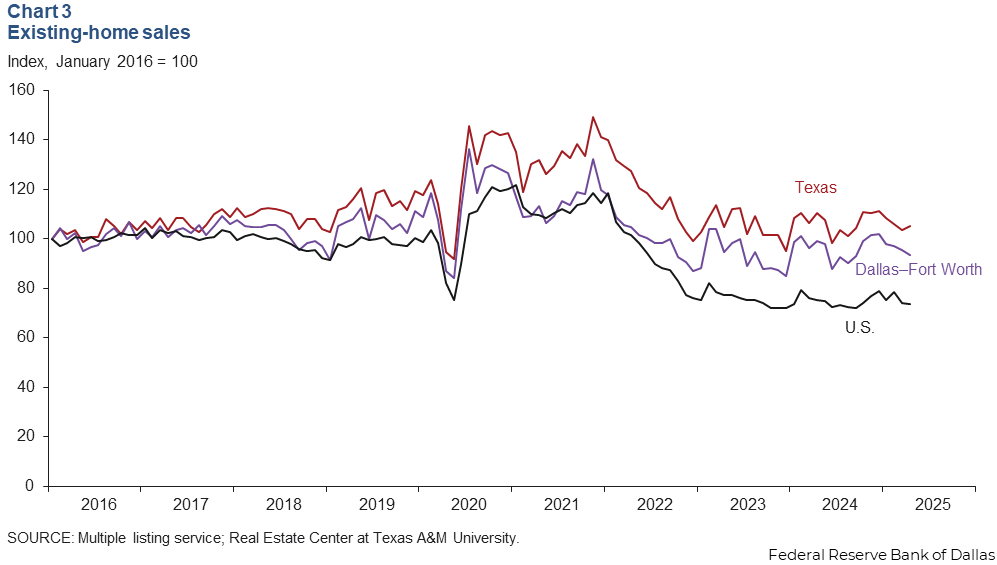
Housing demand remained weak in April. Dallas−Fort Worth existing-home sales fell 1.8 percent and have been trending down since the beginning of the year (Chart 3). Statewide, sales grew 1.6 percent in April, while they fell 0.5 percent nationally. Existing-home inventories in Dallas−Fort Worth ticked up to 4.7 months, while Texas inventories ticked up to 5.5 months.

Home prices dip in the first quarter
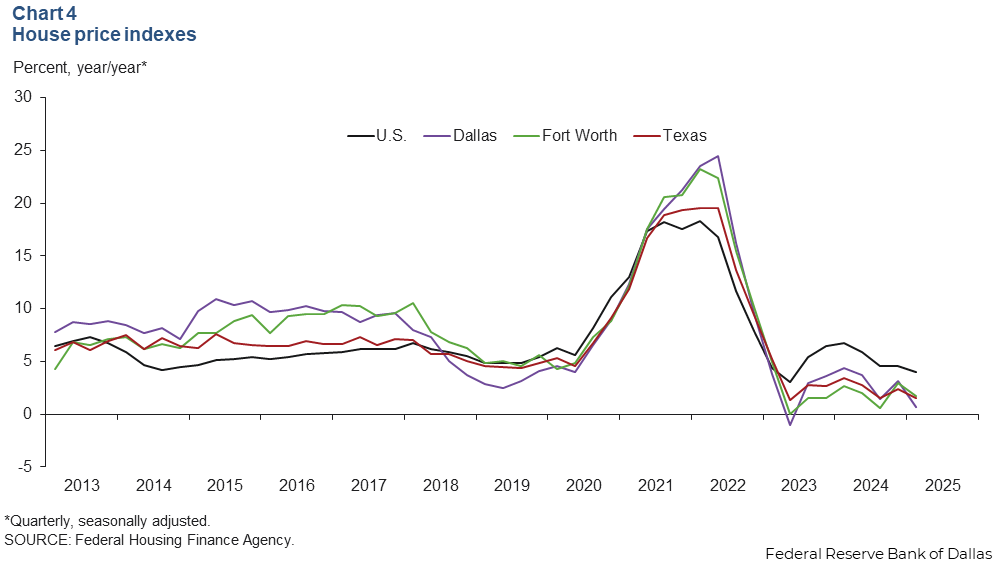
Home prices in Dallas−Fort Worth fell in the first quarter but were up from year-ago levels, according to recently released data from the Federal Housing Finance Agency. Compared with the fourth quarter, prices fell 1.4 percent in Dallas, were flat in Fort Worth and Texas and rose 0.7 percent in the U.S. Year over year, home prices rose 0.6 percent in Dallas, 1.7 percent in Fort Worth and 1.6 percent in Texas, all still lower than the nation’s 4.0 percent increase (Chart 4).

NOTE: Data may not match previously published numbers due to revisions.
About Dallas–Fort Worth Economic Indicators
Questions or suggestions can be addressed to Isabel Dhillon at isabel.dhillon@dal.frb.org. Dallas–Fort Worth Economic Indicators is published every month after state and metro employment data are released.