Dallas−Fort Worth Economic Indicators

| DFW economy dashboard (June 2025) | |||
Job growth (annualized)
March–June '25 |
Unemployment rate |
Avg. hourly earnings |
Avg. hourly earnings growth y/y |
0.5% |
3.5% | $36.69 | 4.7% |
The Dallas–Fort Worth economy slowed in June. Employment declined, and unemployment edged down. Hourly earnings rose and are higher than hourly earnings for both the state and nation. Wage growth lagged slightly behind that of the state but outpaced the national growth. Sales tax collections increased. Office market activity remained weak in the second quarter, while industrial absorption strengthened.
Labor market
Employment declines
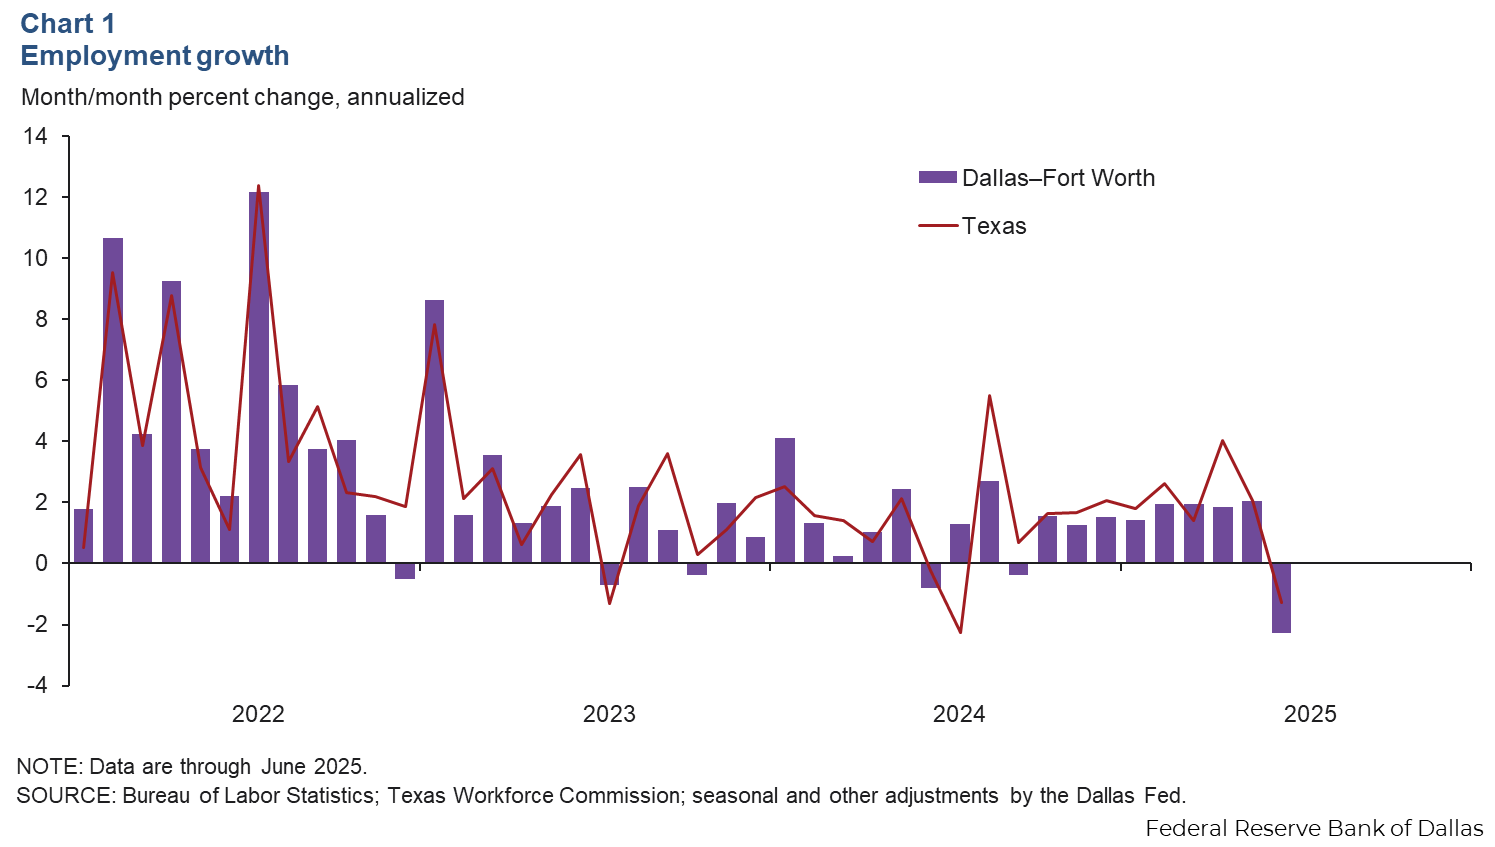
Employment in Dallas−Fort Worth fell an annualized 2.3 percent in June after rising 2.1 percent in May (Chart 1). Employment in Texas fell 1.3 percent in June. Dallas−Fort Worth job growth was mixed across major sectors during the second quarter, with the strongest gains in the education and health services, construction and mining, and government sectors. Employment fell in information, manufacturing, and professional and business services over the period.
Unemployment dips
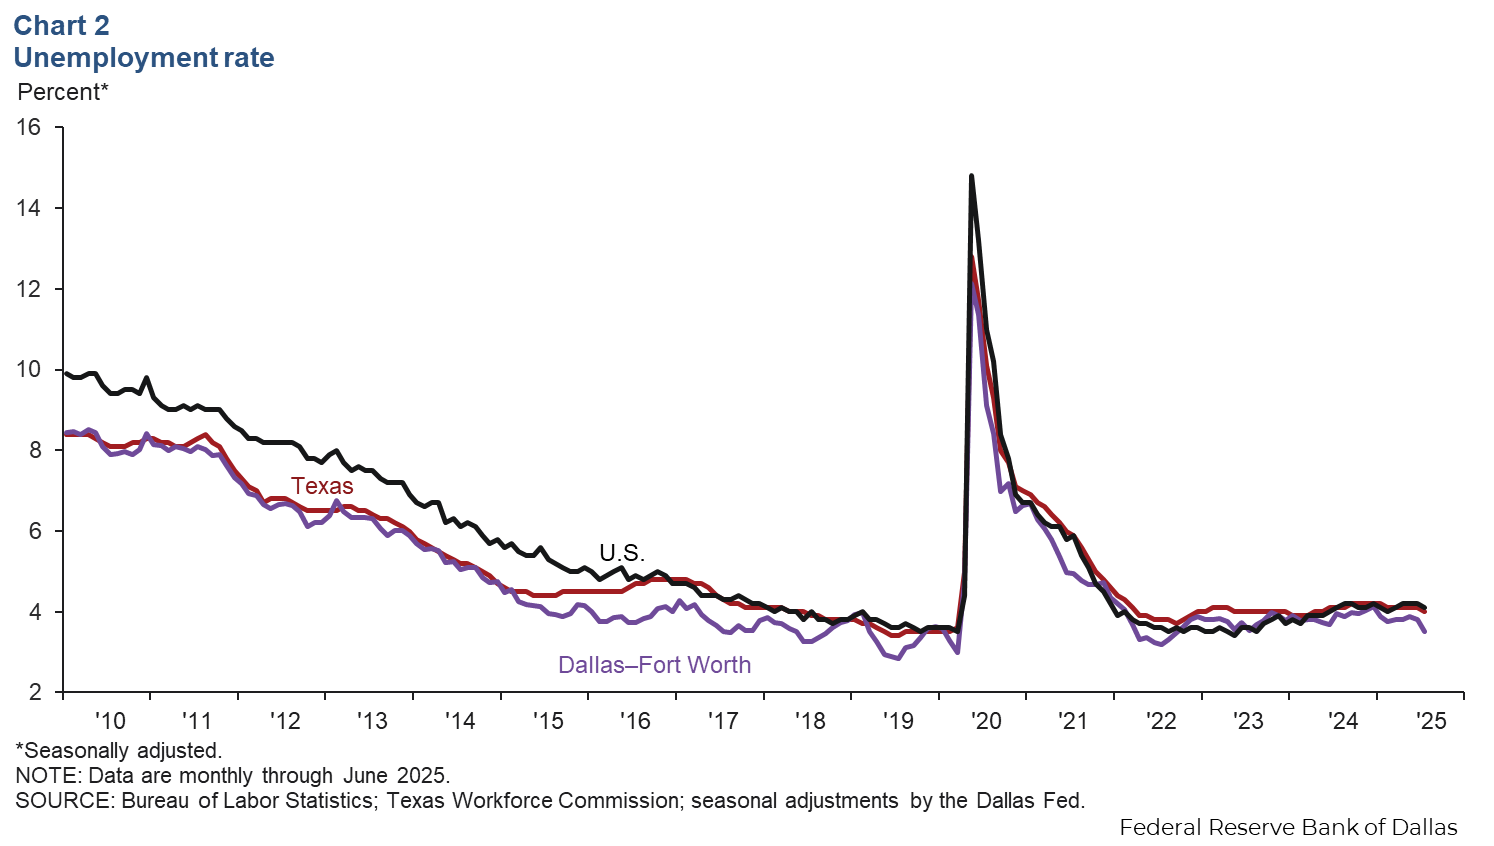
Despite declines in payroll employment, the Dallas-Fort Worth unemployment rate fell to 3.5 percent in June from 3.8 perent in May (Chart 2). The jobless rate was 3.6 percent in Dallas and 3.5 percent in Fort Worth, below the Texas jobless rate of 4.0 percent and the national rate of 4.1 percent.
Earnings edge up in June
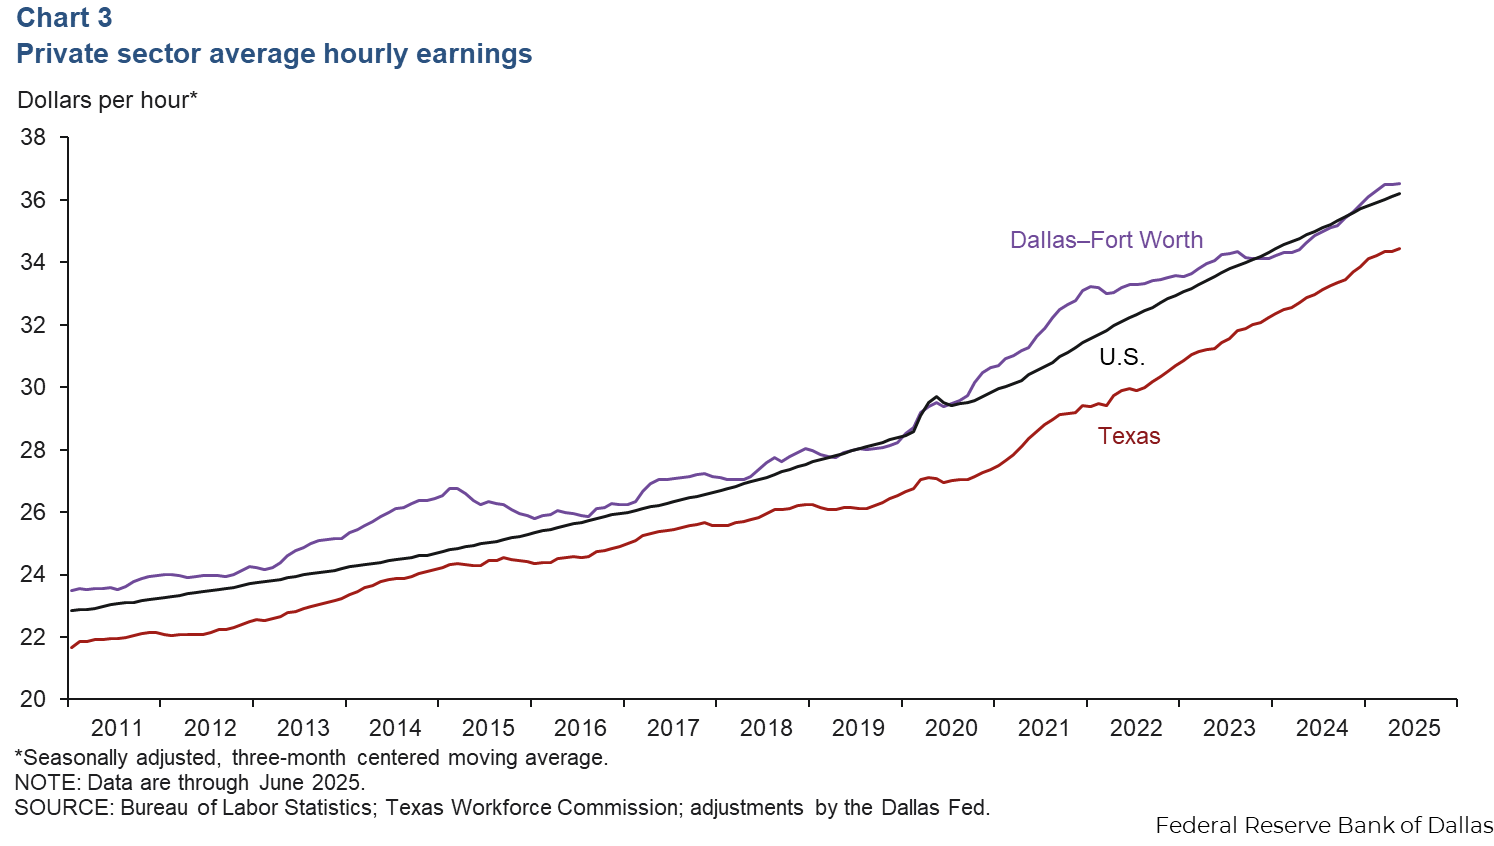
The average nominal hourly wage in Dallas−Fort Worth was $36.69 in June, above the state ($34.70) and national ($36.30) figures. The three-month moving average for Dallas−Fort Worth ticked up to $36.53 (Chart 3). Year-over-year hourly earnings were up 4.7 percent in the metro area, slightly lagging the state (4.9 percent) but outpacing the national (3.7 percent) increase.
Consumer spending
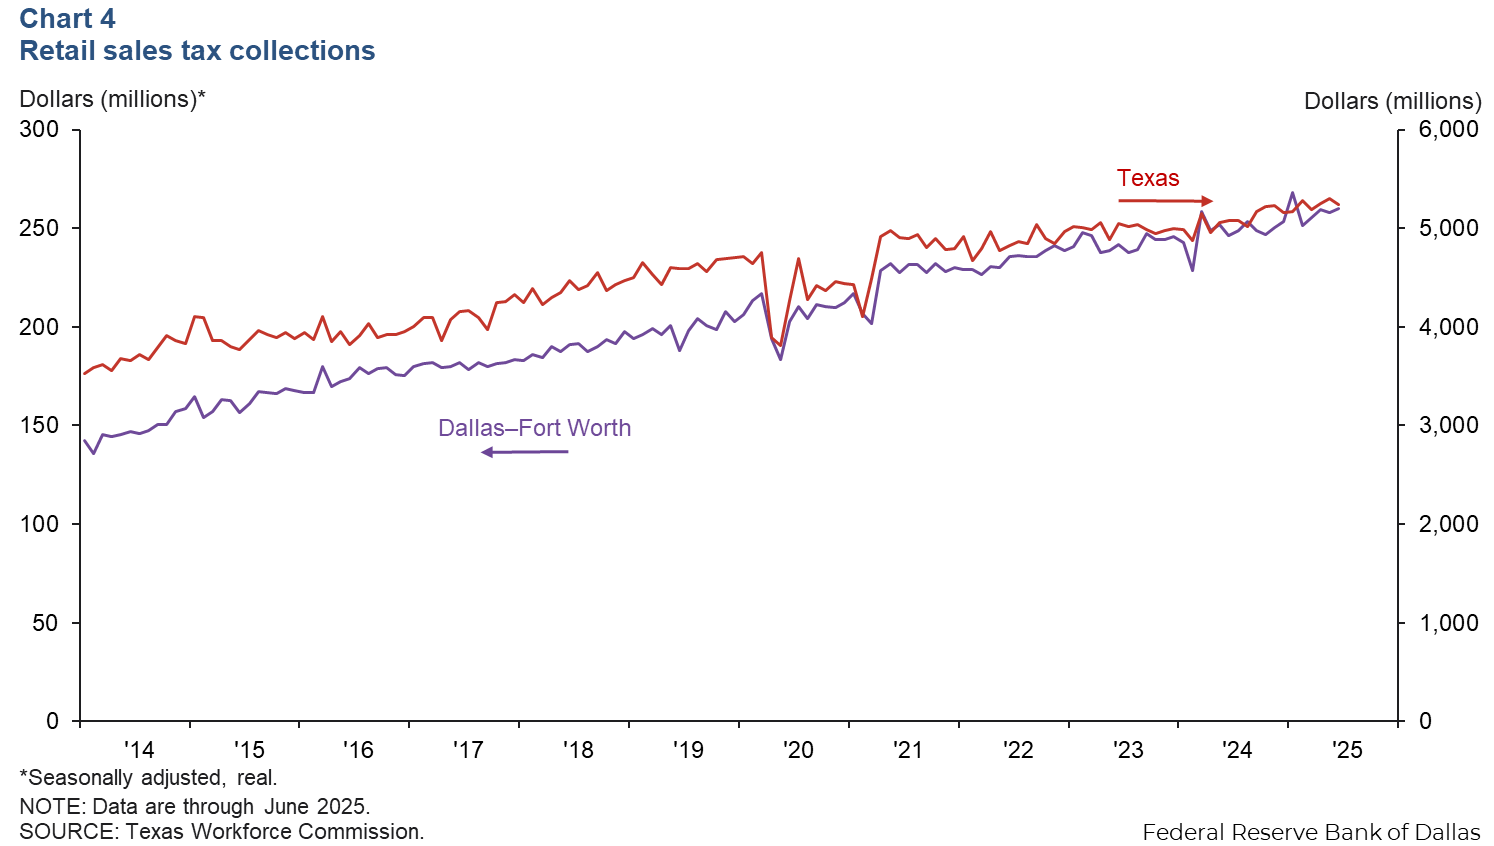
Sales tax receipts, a proxy for consumption, increased in Dallas–Fort Worth in June. The region’s sales tax collections rose 0.8 percent in June to $260 million (Chart 4). Sales tax collections were up 0.6 percent in Dallas and 1.4 percent in Fort Worth. However, the state’s sales tax collections declined 1.0 percent. Year-over-year sales tax collections rose 5.6 percent in Dallas−Fort Worth, while Texas collections rose 3.2 percent.
Commercial real estate
Office vacancy continues to creep up
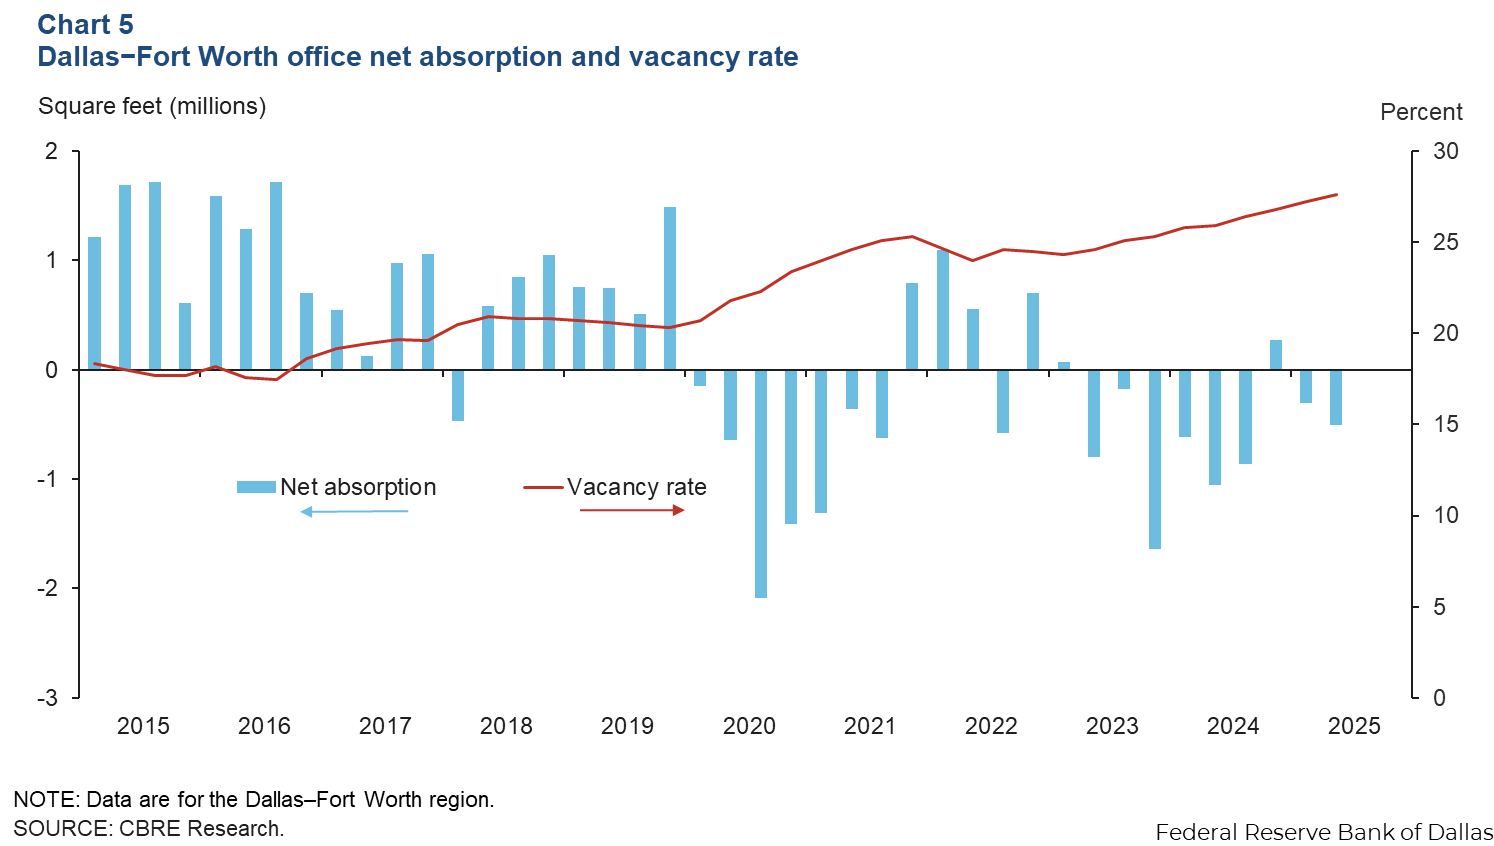
Demand for office space in Dallas−Fort Worth remained weak in second quarter 2025. Net absorption was negative for the second straight quarter at just over half a million square feet, pushing up the vacancy rate to a multiyear high of 27.6 percent, according to data from CBRE Research (Chart 5 ). The metro area had 62.0 million square feet of vacant office space at the end of the second quarter. Availability of sublease space increased to 8.0 million square feet. Construction activity rose slightly to 2.7 million square feet.
Industrial leasing stays solid
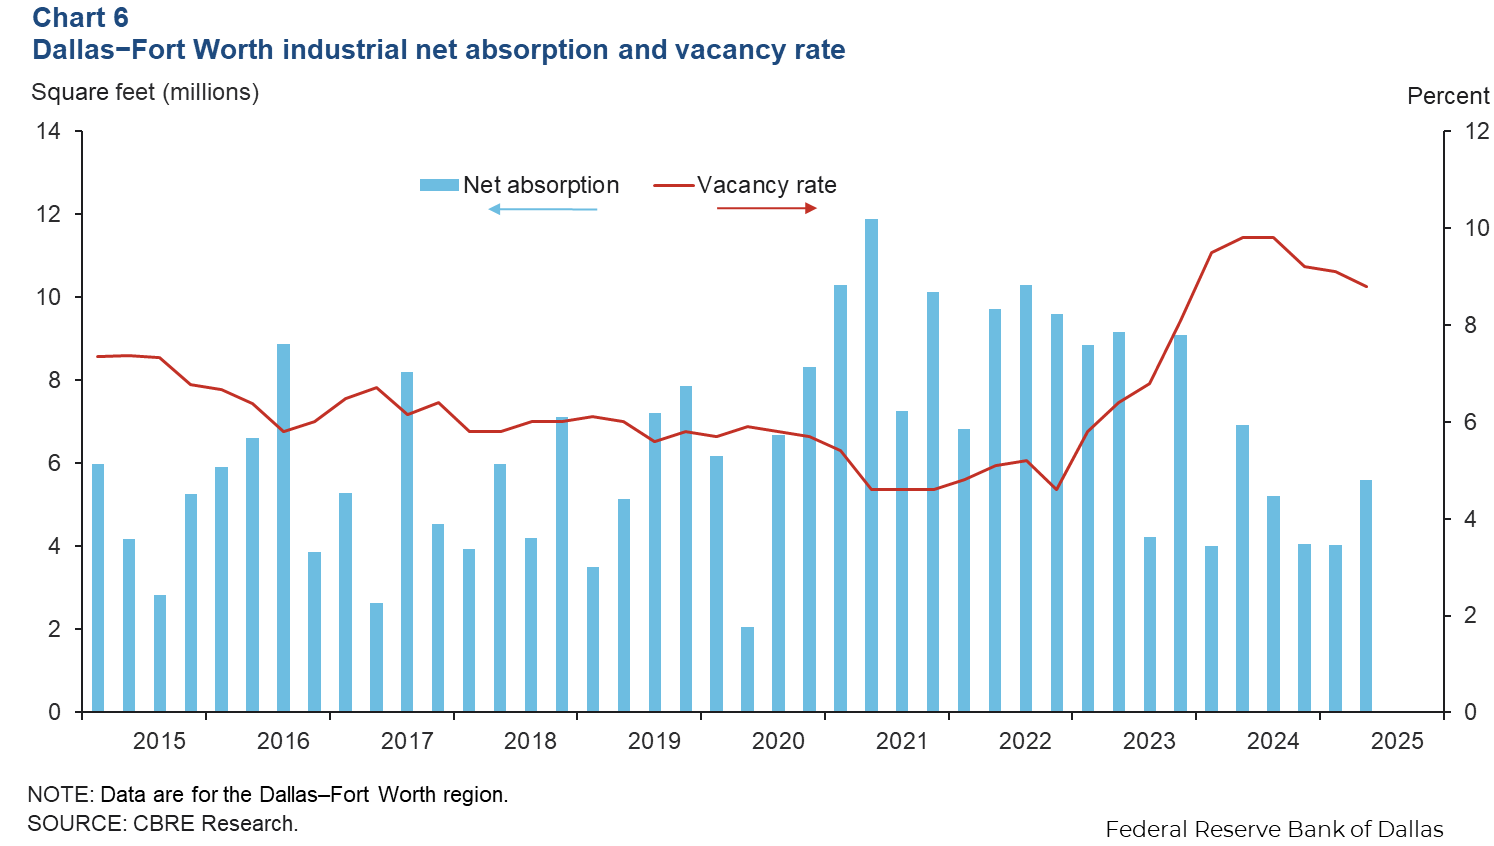
Positive momentum in industrial leasing continued in the second quarter, driven primarily by demand from third-party logistics, warehouse and storage, and manufacturing. Net absorption was 5.6 million square feet, outpacing the first quarter, according to CBRE (Chart 6). The vacancy rate declined to 8.8 percent, with the South Stemmons and North Fort Worth submarkets recording the lowest vacancy rates. Space under construction increased to 15.4 million square feet.
NOTE: Data may not match previously published numbers due to revisions.
About Dallas–Fort Worth Economic Indicators
Questions or suggestions can be addressed to Dylan Council. Dallas–Fort Worth Economic Indicators is published every month after state and metro employment data are released.