Dallas−Fort Worth Economic Indicators

| DFW economy dashboard (August 2025) | |||
Job growth (annualized)
May–Aug. '25 |
Unemployment rate |
Avg. hourly earnings |
Avg. hourly earnings growth y/y |
0.3% |
4.1% | $36.39 | 4.2% |
The Dallas–Fort Worth economy expanded in August. Employment growth was strong, while unemployment increased sharply. Hourly earnings were flat but remained higher than figures for the state and nation and above year-ago levels. DFW sales tax collections held steady. Home sales fell, while apartment rents were flat.
Labor market
Employment increases
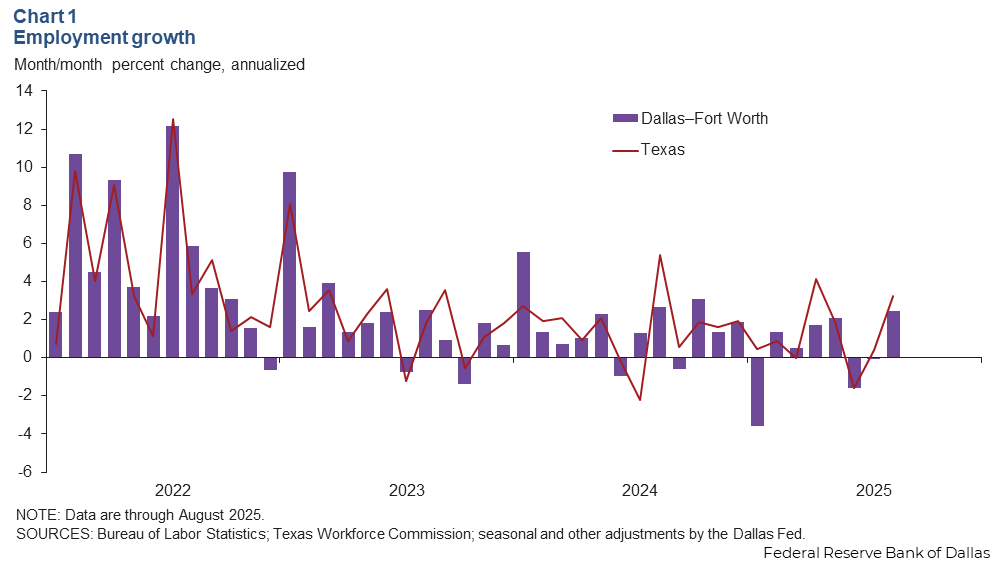
Employment in Dallas−Fort Worth grew an annualized 2.5 percent in August after holding steady in July (Chart 1). Employment in Texas grew 3.2 percent in August. Dallas−Fort Worth job growth from May to August was mixed across major sectors, with the strongest gains in the educational and health services, information, and government sectors. Meanwhile, employment losses were largest in construction, financial activities, and professional and business services over the same period.
Unemployment rises
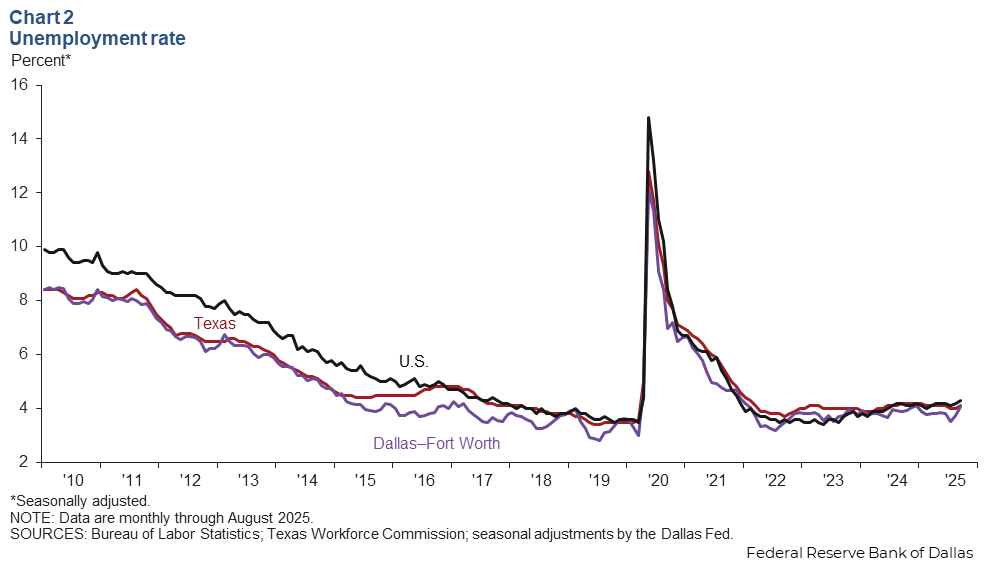
Despite growth in payroll employment, the Dallas-Fort Worth unemployment rate rose to 4.1 percent in August from 3.7 percent in July (Chart 2). This marked the second consecutive month of increases in the unemployment rate. The jobless rate was 4.1 percent in Dallas and 4.0 percent in Fort Worth, in line with Texas’ jobless rate of 4.1 percent but below the national rate of 4.3 percent.
Earnings flat in August
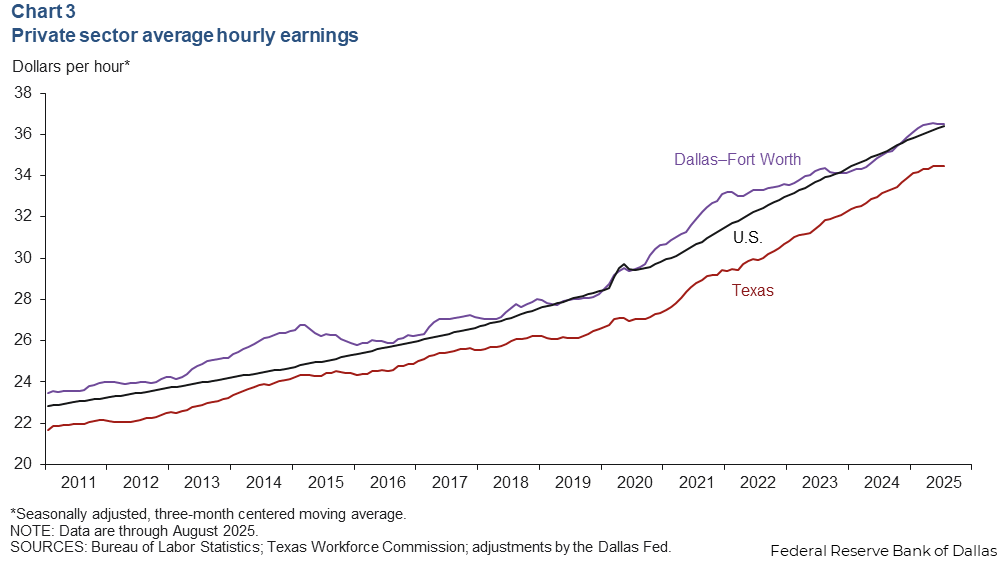
The average nominal hourly wage in Dallas−Fort Worth was $36.39 in August, above the state average ($34.33) but below the national average ($36.53). The three-month moving average of hourly earnings for Dallas−Fort Worth was unchanged at $36.52 (Chart 3). Year over year, hourly earnings were up 4.2 percent in the metro area, outpacing the state (3.1 percent) and national (3.7 percent) increases.
Consumer spending
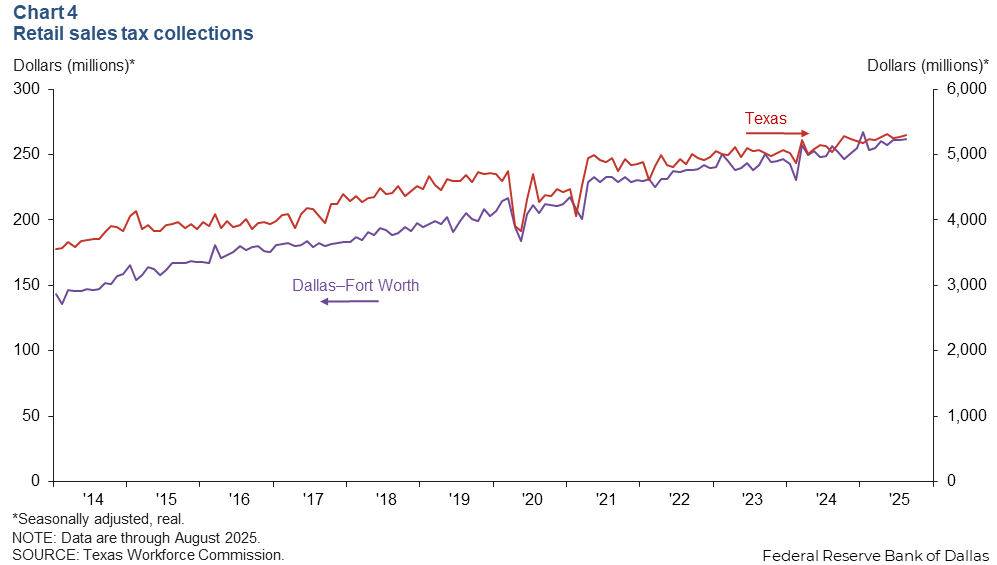
Sales tax receipts, a proxy for consumption, held steady in Dallas–Fort Worth in July. The region’s sales tax collections were little changed in July at $261 million (Chart 4). Sales tax collections were up 0.3 percent in Dallas but declined 0.7 percent in Fort Worth. State sales tax collections rose 0.5 percent in August. Year over year, sales tax collections rose 2.1 percent in Dallas–Fort Worth and 5.0 percent in Texas.
Residential real estate
Home sales decline
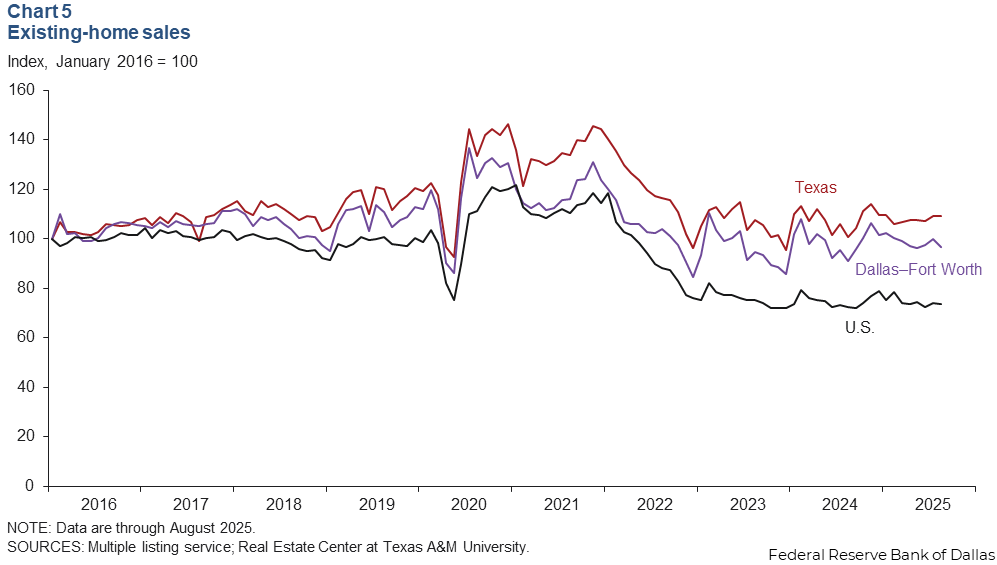
Housing demand slowed in August. Dallas–Fort Worth existing-home sales fell 3.3 percent after rising 2.8 percent in July (Chart 5). Statewide, sales edged up 0.1 percent in August, while they ticked down 0.2 percent nationally. Home inventories in Dallas–Fort Worth declined to 4.2 months, while Texas inventories ticked down to 5.2 months.
Apartment rents flat
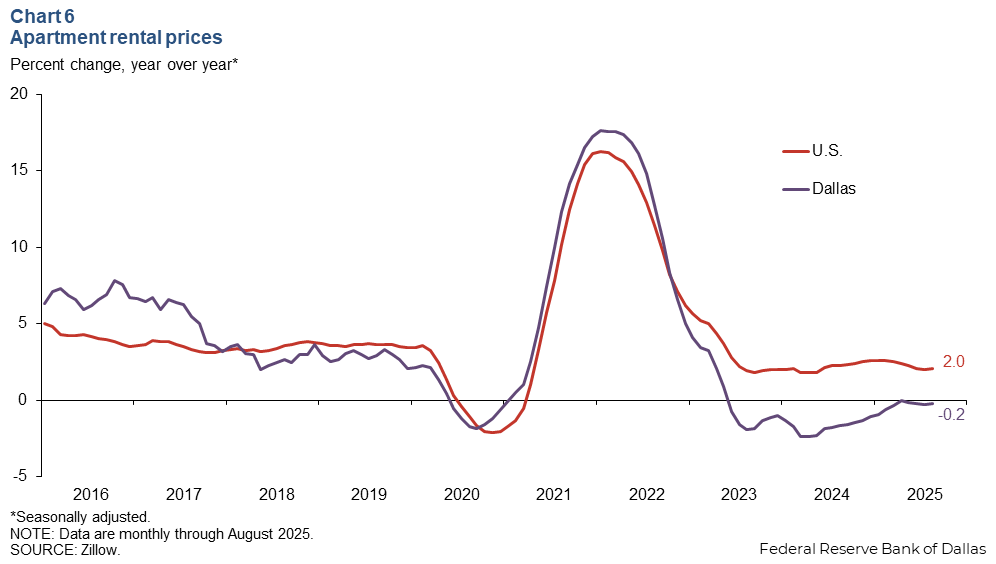
Year over year, apartment rents ticked down 0.2 percent in Dallas in August and rose 2.0 percent nationwide (Chart 6). Dallas apartment rental rates averaged $1,540 in August, below the U.S. average of $1,840. Rents were unchanged from July to August in Dallas but edged up 0.2 percent nationally.
NOTE: Data may not match previously published numbers due to revisions.
About Dallas–Fort Worth Economic Indicators
Questions or suggestions can be addressed to Dylan Council. Dallas–Fort Worth Economic Indicators is published every month after state and metro employment data are released.