Dallas−Fort Worth Economic Indicators

| DFW economy dashboard (November 2025) | |||
Job growth (annualized)
Aug.–Nov. '25 |
Unemployment rate |
Avg. hourly earnings |
Avg. hourly earnings growth y/y |
-0.8% |
4.2% | $37.71 | 6.0% |
The Dallas–Fort Worth economy slowed in November. Employment declined, while unemployment remained flat. Hourly earnings rose and were higher than the state and nation as well as above year-ago levels. Sales tax collections for the metro area declined in December but were up from the year prior. Office and industrial market activity increased in the fourth quarter.
Labor market
Employment decreases
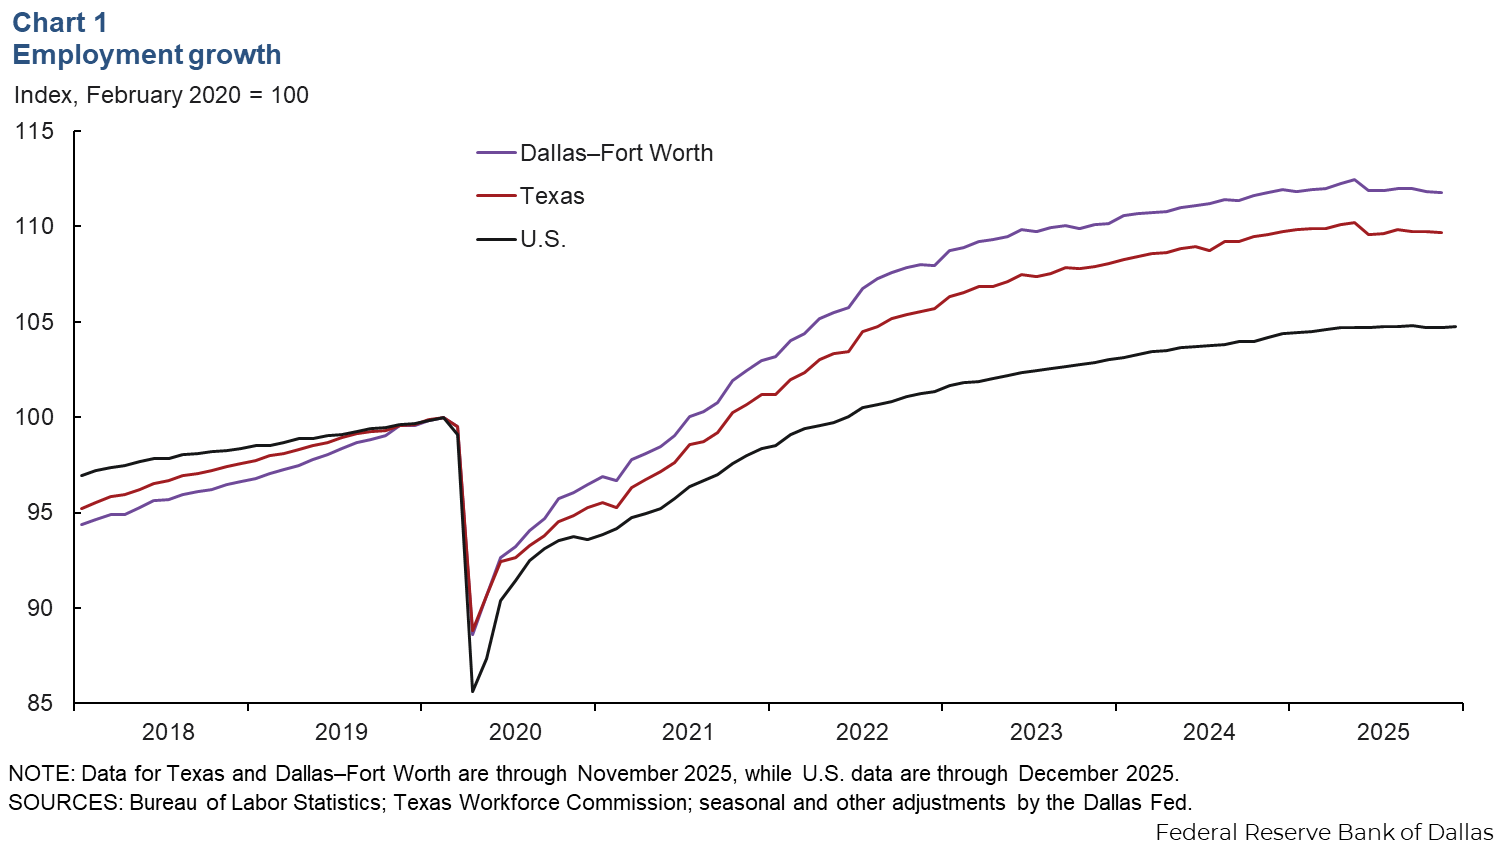
Employment in Dallas−Fort Worth declined an annualized 0.9 percent in November after falling 1.3 percent in October (Chart 1). Employment in Texas dipped 0.4 percent in November. Dallas−Fort Worth job growth in the three months ending in November was mixed across major sectors, with the strongest gains in mining and construction, other services and education and health services. Meanwhile, employment losses were largest in the professional and business services, manufacturing, financial activities, and trade and transportation and utilities sectors.
Unemployment flat
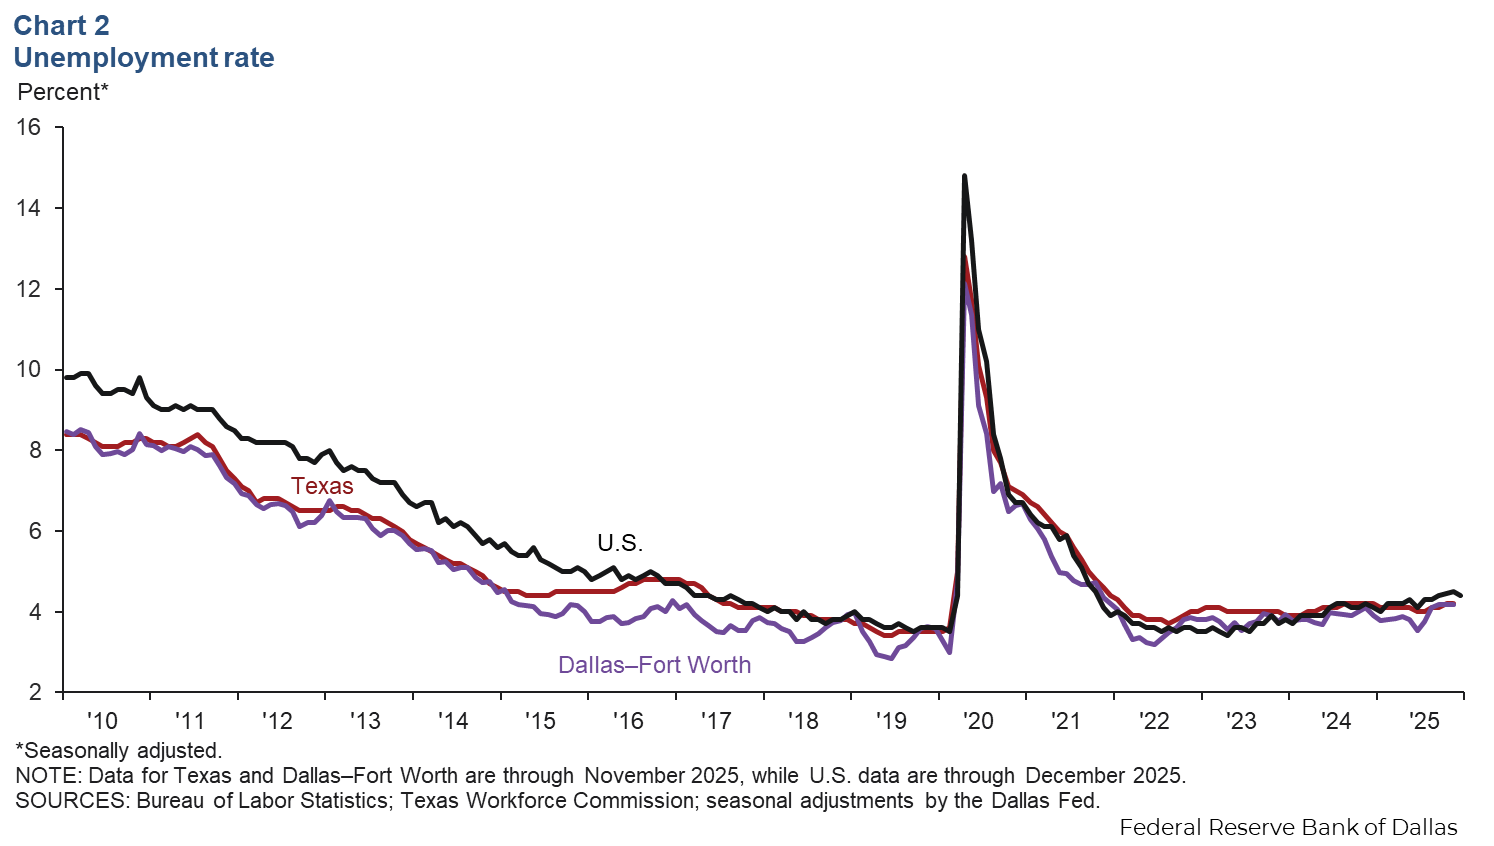
Despite declines in payroll employment, the Dallas−Fort Worth unemployment rate held steady at 4.2 percent (Chart 2). The November jobless rate was 4.2 percent in Dallas and 4.1 percent in Fort Worth, in line with Texas’ jobless rate of 4.2 percent. The U.S. unemployment rate was 4.4 percent in December.
Earnings increase in November
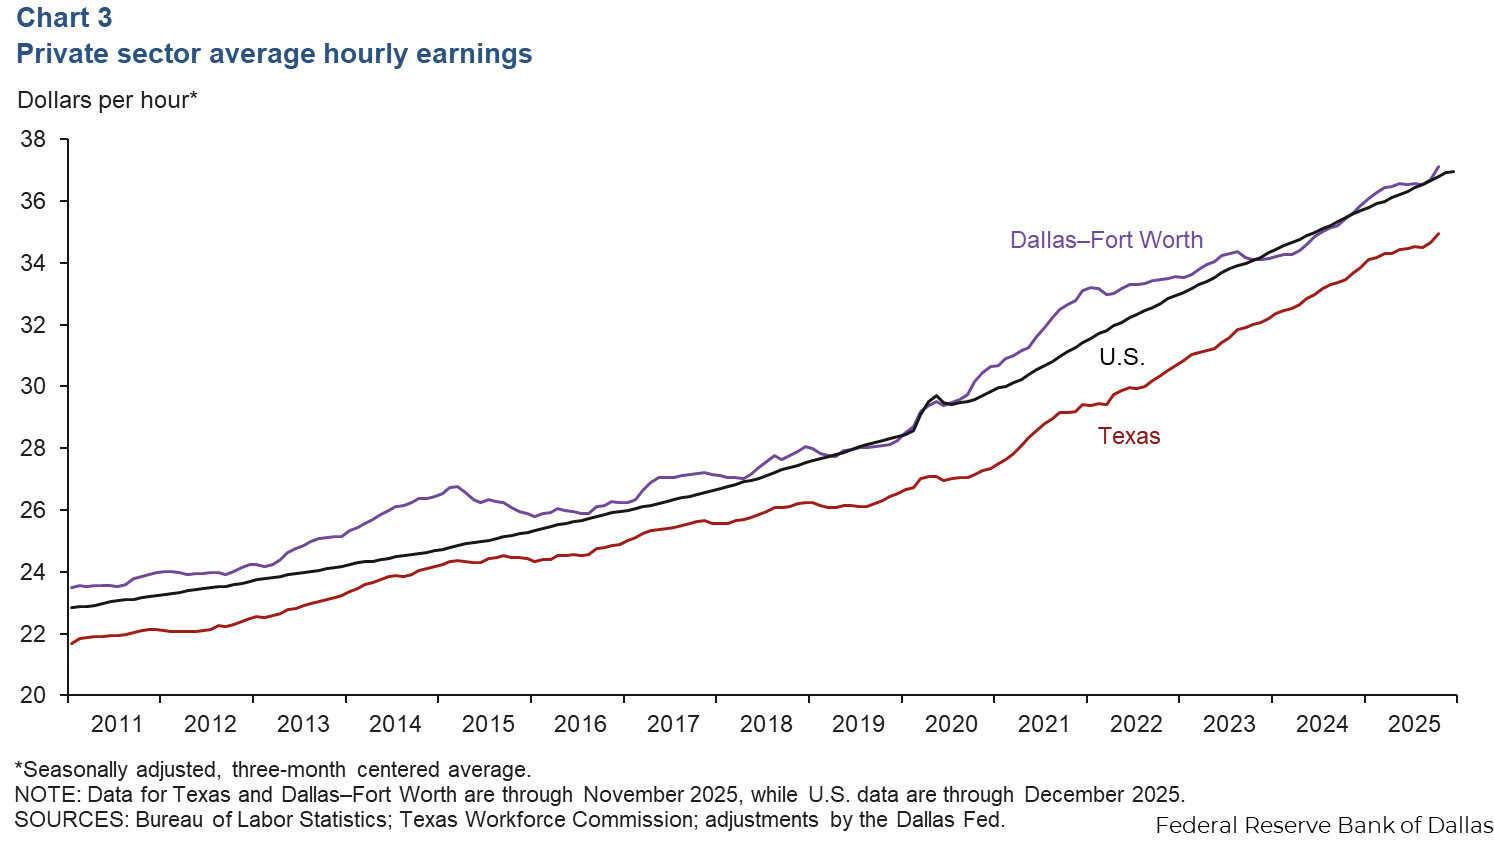
The average nominal hourly wage in Dallas−Fort Worth rose to $37.71 in November, up from $36.88 in October. Hourly wages in the region were above the state figure ($35.27) (Chart 3). The national average hourly wage ticked up $37.02 in December and was up 3.8 percent from a year earlier. Year-over-year hourly earnings were up 6.0 percent in the metro area, outpacing the state increase (5.1 percent).
Consumer spending
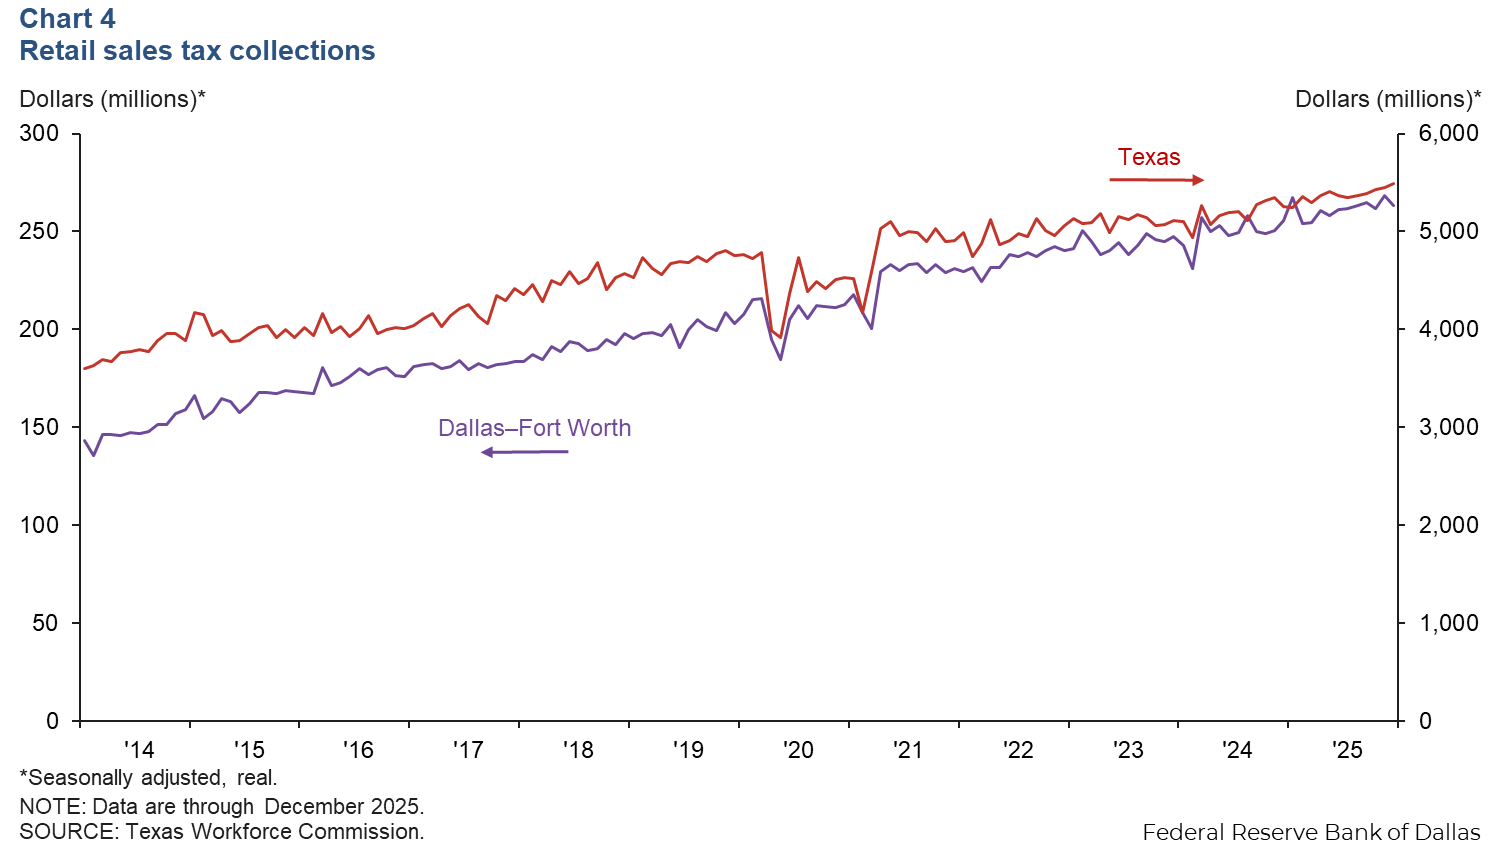
Sales tax receipts, a proxy for consumption, dipped in Dallas–Fort Worth in December. The region’s sales tax collections fell 2.1 percent month over month to $263 million (Chart 4). Sales tax collections were down 2.4 percent in Dallas and 1.3 percent in Fort Worth. State sales tax collections rose 0.9 percent in December. Year-over-year sales tax collections were up 2.9 percent in Dallas–Fort Worth and 4.5 percent in Texas.
Commercial real estate
Office vacancy declines
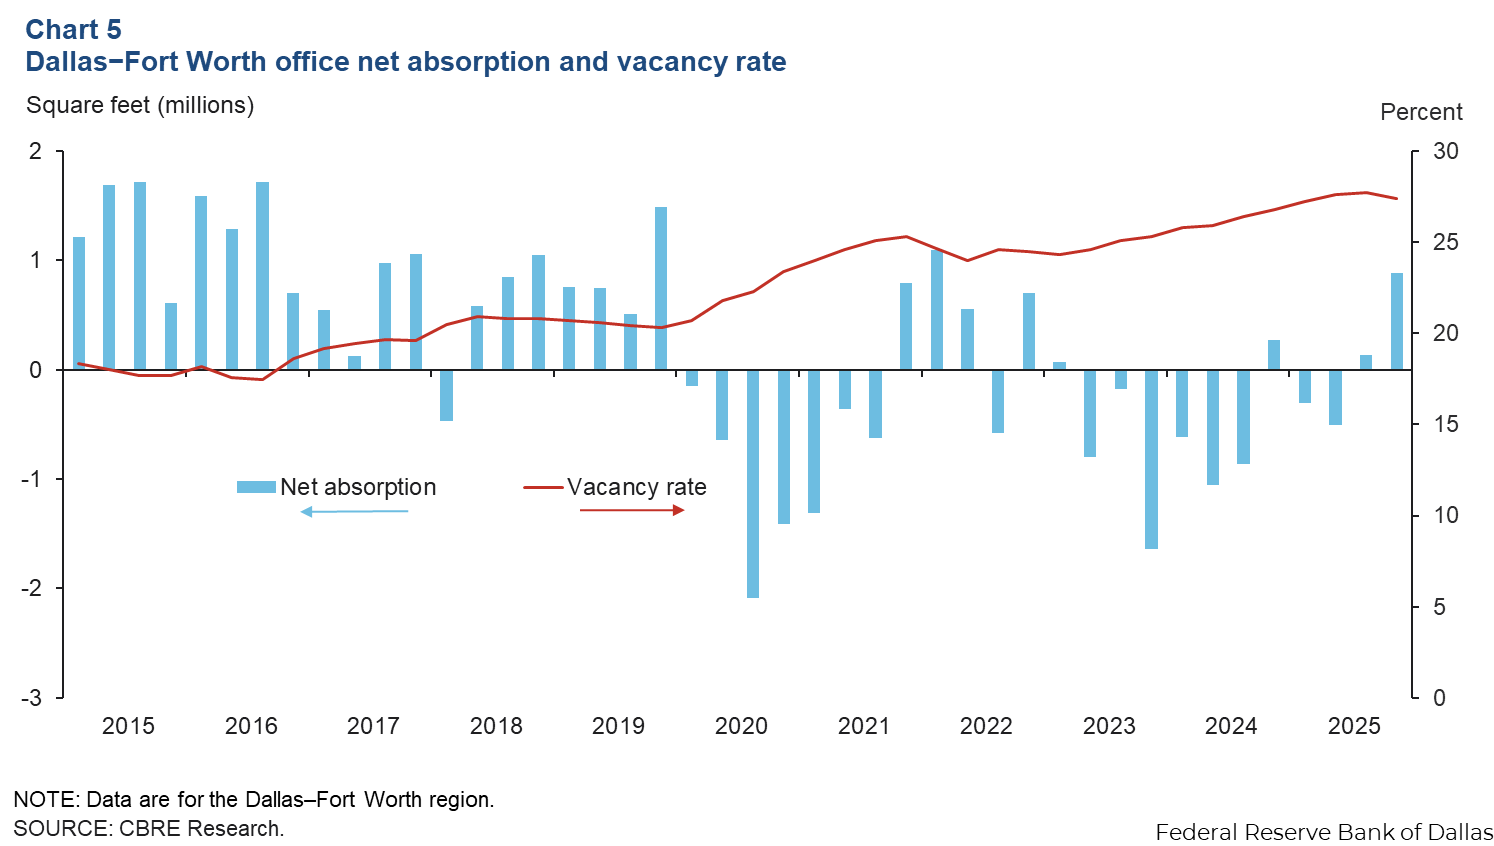
Demand for office space in Dallas–Fort Worth rose in fourth quarter 2025. Net absorption was nearly 880,000 square feet, with the bulk of the absorption in class A space, according to data from CBRE Research (Chart 5). The vacancy rate dipped to 27.4 percent, declining across all classes. The metro area had 63.1 million square feet of vacant office space at year-end 2025. Availability of sublease space decreased to 6.3 million square feet. Construction activity rose from 2.0 million square feet to 2.6 million square feet.
Industrial leasing picks up
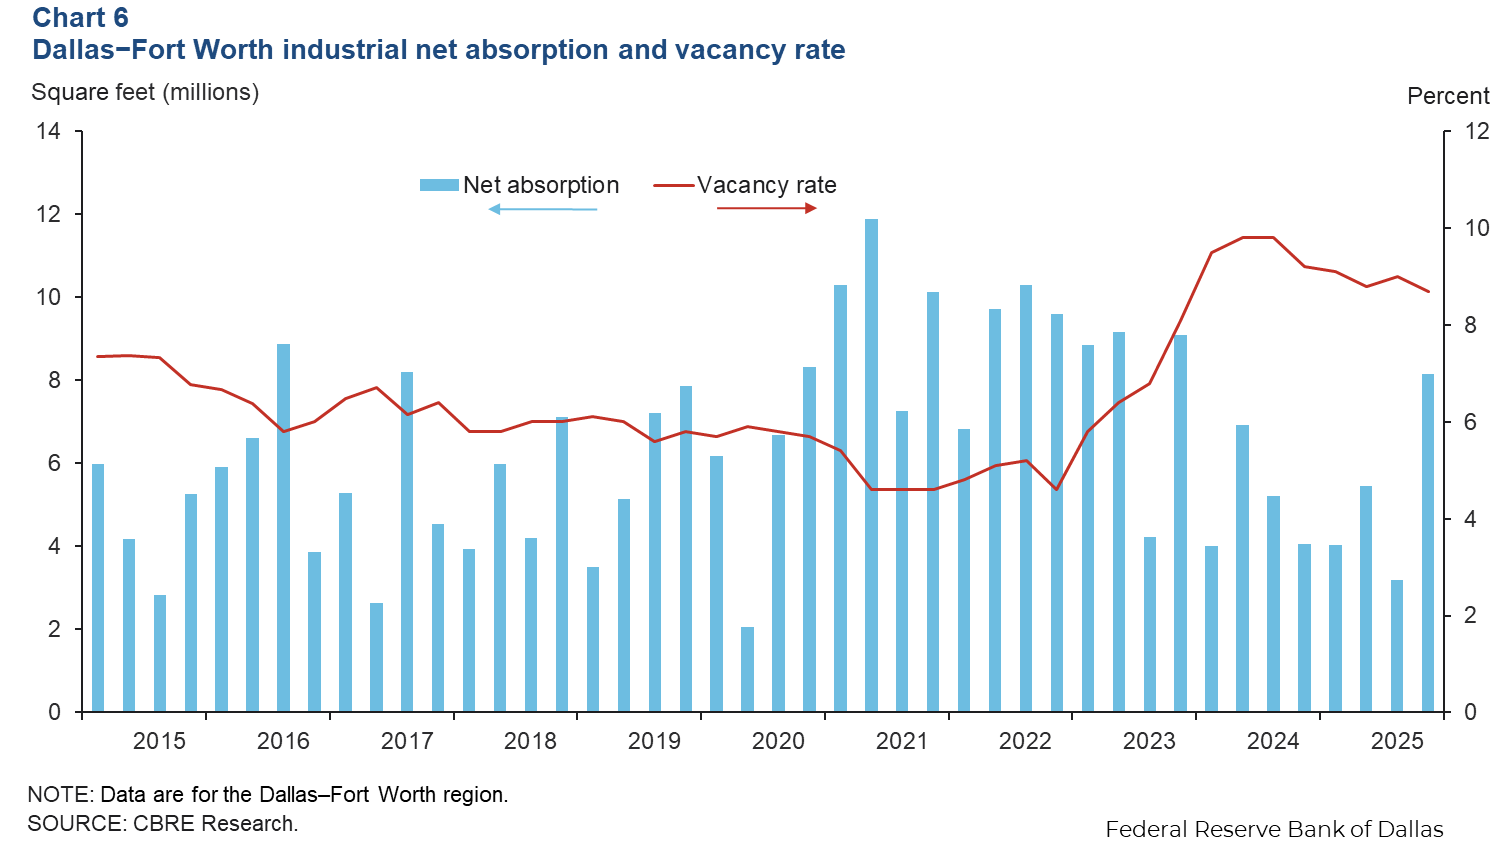
Industrial real estate demand in Dallas-Fort Worth remained solid in fourth quarter of 2025 driven by manufacturing, third party logistics and warehousing. Net absorption was 8.1 million square feet in the fourth quarter, bringing the 2025 total to 20.8 million square feet, according to CBRE (Chart 6). The vacancy rate dipped to 8.7 percent, with the South Stemmons and Northeast Dallas submarkets continuing to record the lowest vacancy rates. Space under construction increased to 22.6 million square feet.
NOTE: Data may not match previously published numbers due to revisions.
About Dallas–Fort Worth Economic Indicators
Questions or suggestions can be addressed to Dylan Council. Dallas–Fort Worth Economic Indicators is published every month after state and metro employment data are released.