El Paso Economic Indicators

El Paso's economy continues to expand. While employment contracted in February, jobs rose 1.2 percent year to date. Existing-home sales dipped, while median-home prices inched up in February. Trade through the port remains steady, and maquiladora employment also remains solid.
Business-Cycle Index
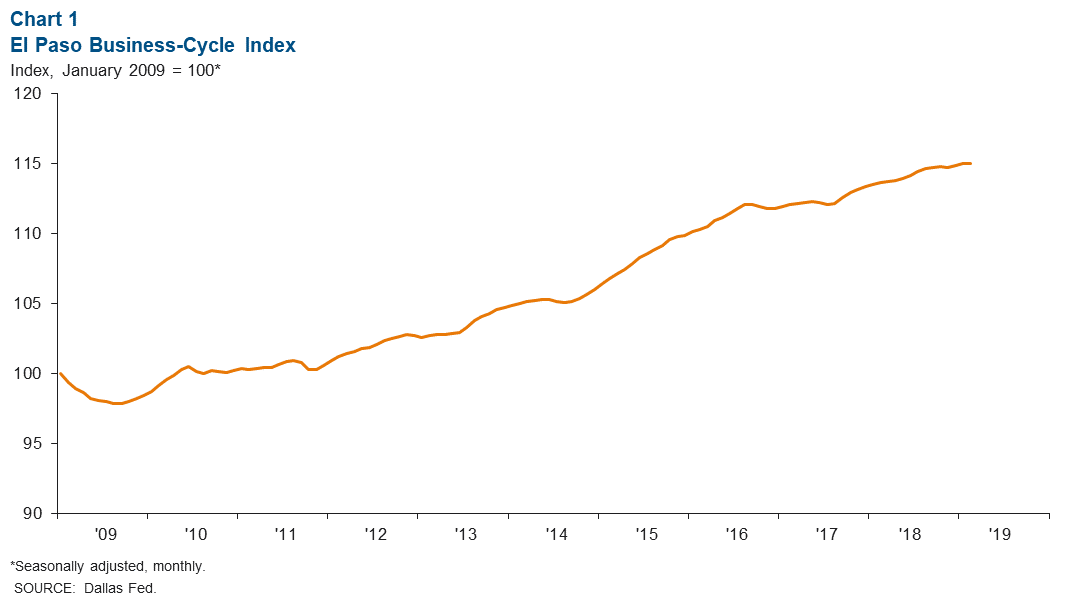
The El Paso Business-Cycle Index edged up an annualized 0.4 percent in February, below January’s increase of 1.4 percent (Chart 1). Slower gains in the index are likely attributed to the softer labor market.
Labor Market
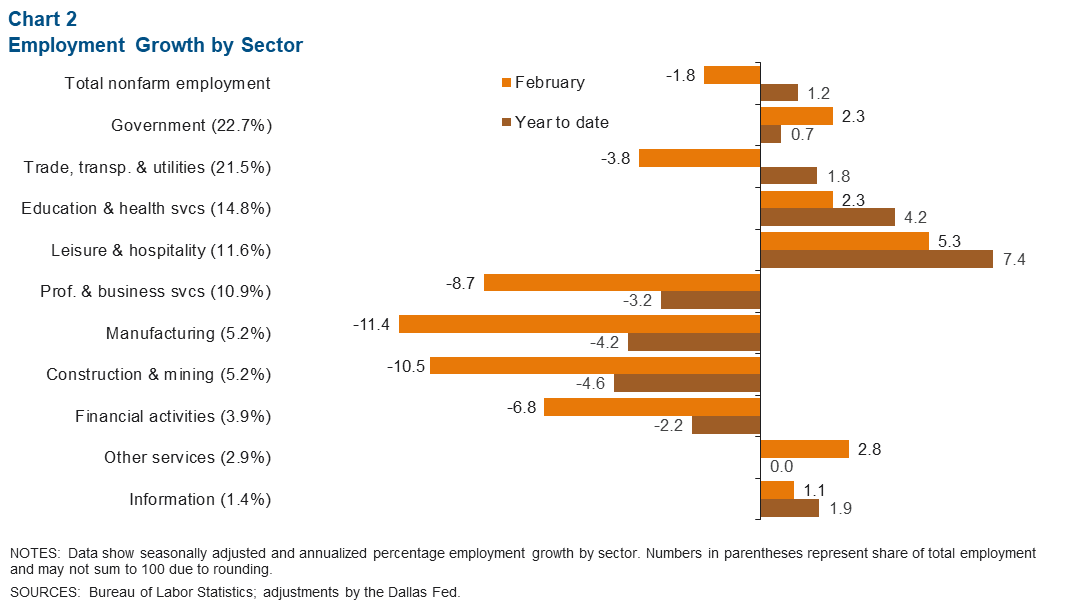
In February, El Paso jobs contracted an annualized 1.8 percent, and job growth was mixed across sectors (Chart 2). However, El Paso’s job gains year to date were positive at an annualized 1.2 percent, slightly below their long-term average of 1.5 percent. Year to date, most major sectors added jobs. Leisure and hospitality, which accounts for one of every 10 jobs, posted the strongest growth—up 7.4 percent year to date. El Paso’s unemployment rate in February was 4.3 percent, above the 3.8 percent figure for both Texas and the U.S.
Housing Market
Housing sales slowed in February to an annualized 8,481, down from the most recent peak of 8,788 sales seen in September 2018 (Chart 3). Meanwhile, the median price ticked up to $156,495, up 1.5 percent from January and up 2.1 percent from February 2018.
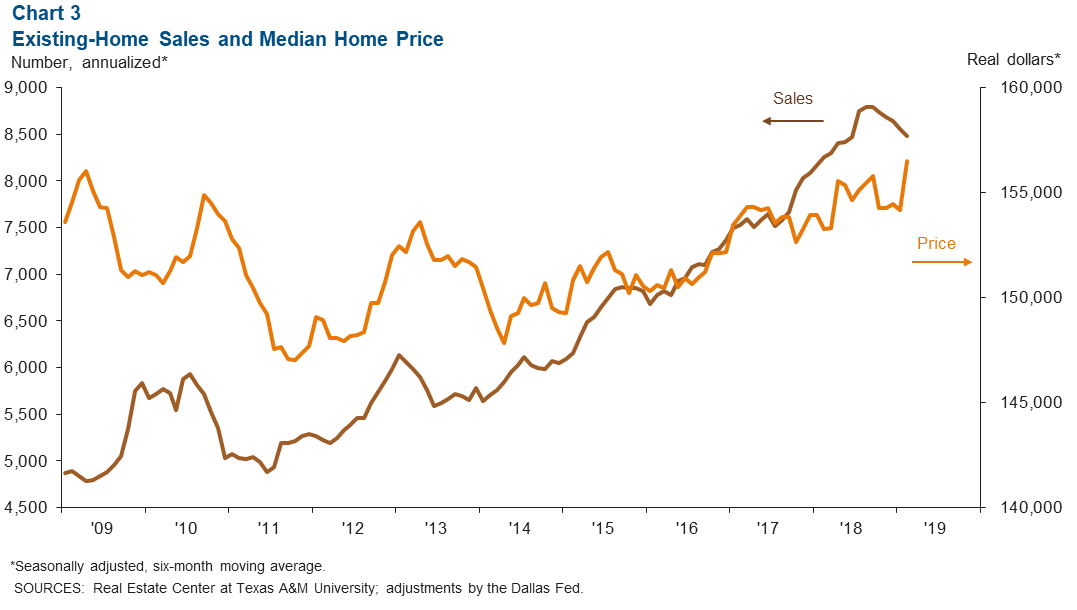
While sales have slowed, inventories remain low. In February, inventories stood at 3.7 months, well below the six months of supply considered to be a balanced market.
Trade
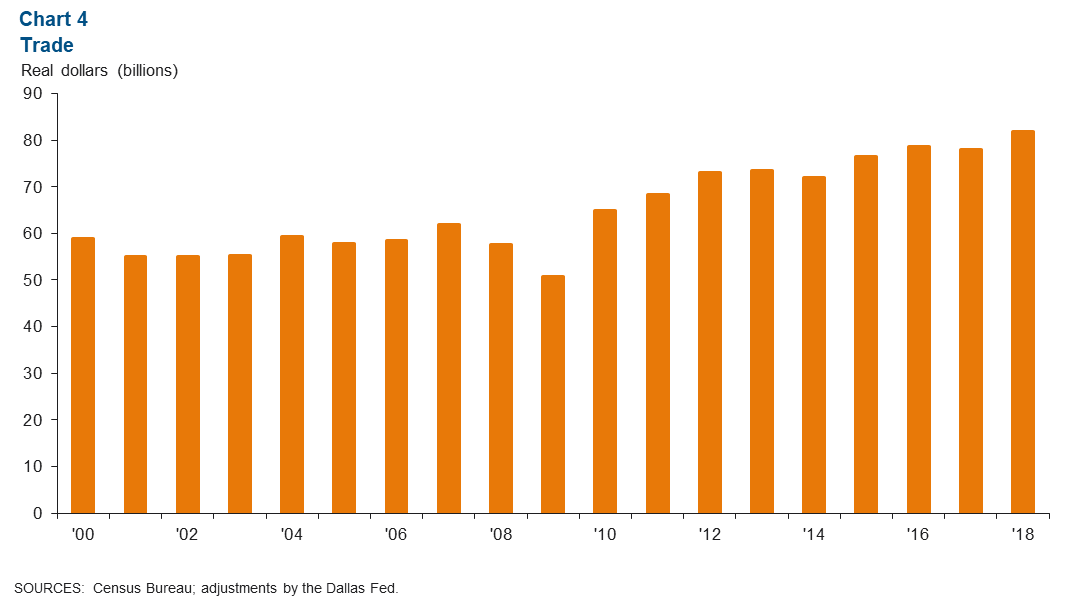
In 2018, trade through the port totaled $81.9 billion, up 5.1 percent from $77.9 billion in 2017 (Chart 4). Gains in total trade were boosted by both increasing imports and exports. Exports totaled $32.3 billion, up 8.3 percent from the previous year; imports rose 3.1 percent over the year to $49.6 billion.
Industrial Production and Maquiladora Activity
U.S. industrial production rose 3.5 percent year over year in February (Chart 5). The Institute for Supply Management manufacturing index fell from 56.6 in January to 54.2 in February, but the reading remains above 50, which signals expansion. U.S. manufacturing conditions remain solid. U.S. and Mexican production and manufacturing trends are important to the local economy because of cross-border manufacturing relationships.
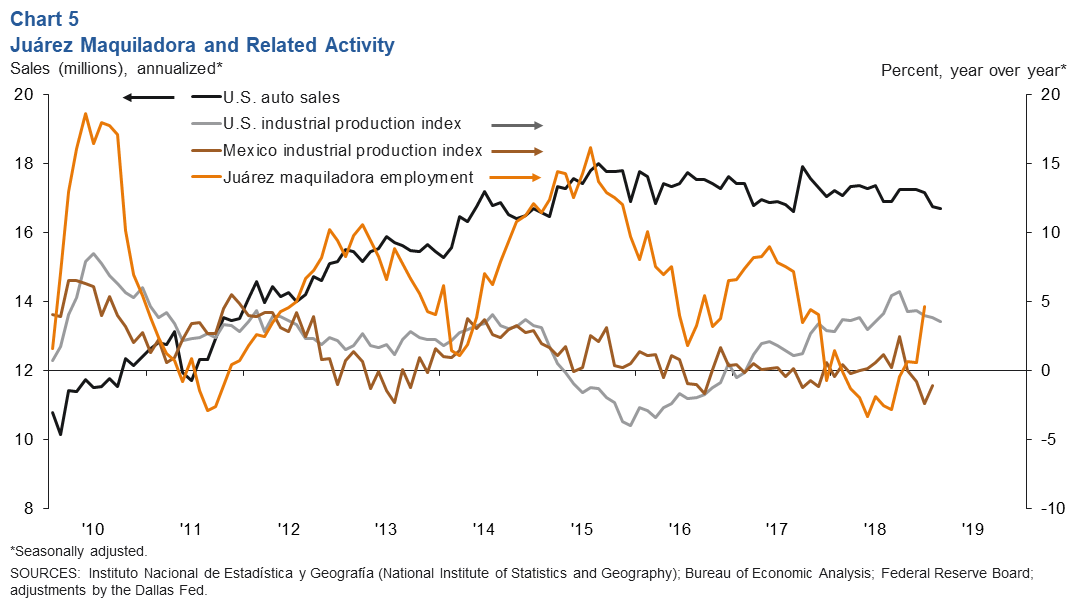
Across the border from El Paso, Juárez maquiladora employment posted year-over-year growth in December. According to Mexico’s official series, maquiladora employment rose 4.7 percent in December to 278,315.
U.S. auto and light-truck production was 10.6 million units in February, below the 11.0 million units produced a year earlier. Meanwhile, monthly auto sales totaled 16.7 million, down from year-ago sales of 17.1 million. Auto sales are closely linked to the local economy because roughly half of maquiladoras in Juárez are auto related.
NOTE: Data may not match previously published numbers due to revisions. The El Paso metropolitan statistical area includes El Paso and Hudspeth counties.
About El Paso Economic Indicators
Questions can be addressed to Marycruz De León at marycruz.deleon@dal.frb.org. El Paso Economic Indicators is released on the fourth Wednesday of every month.