El Paso Economic Indicators

El Paso’s economy continues to expand, with jobs rising 2.1 percent year to date. March existing-home sales picked up from February but are below year-ago levels. Maquiladora employment is solid, with employment over 280,000 in January.
Business-Cycle Index
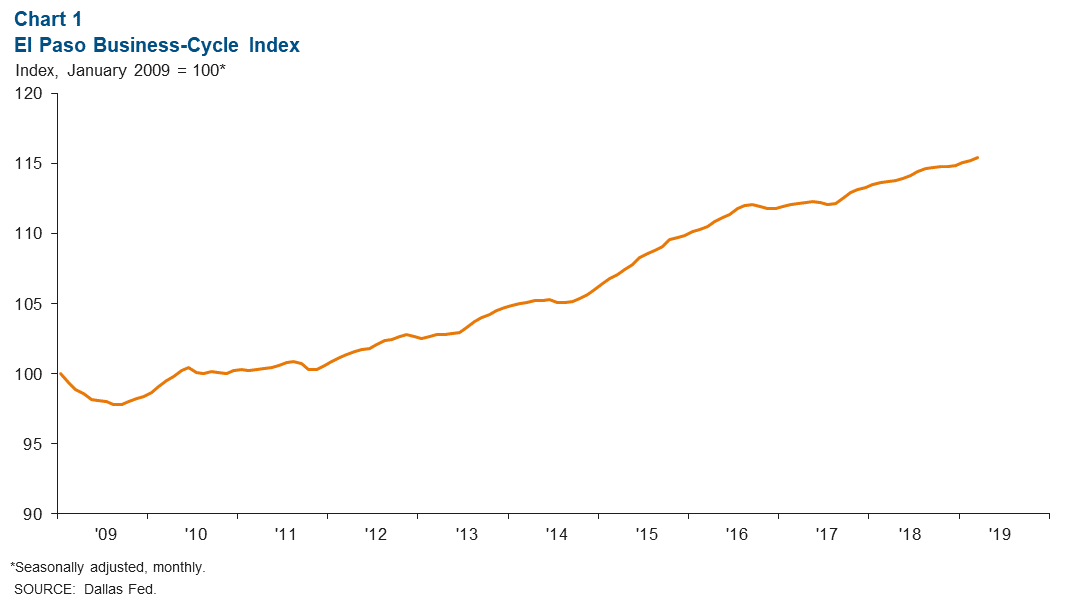
The El Paso Business-Cycle Index rose an annualized 2.7 percent in March (Chart 1). The gain was partly driven by the strong jobs market.
Labor Market
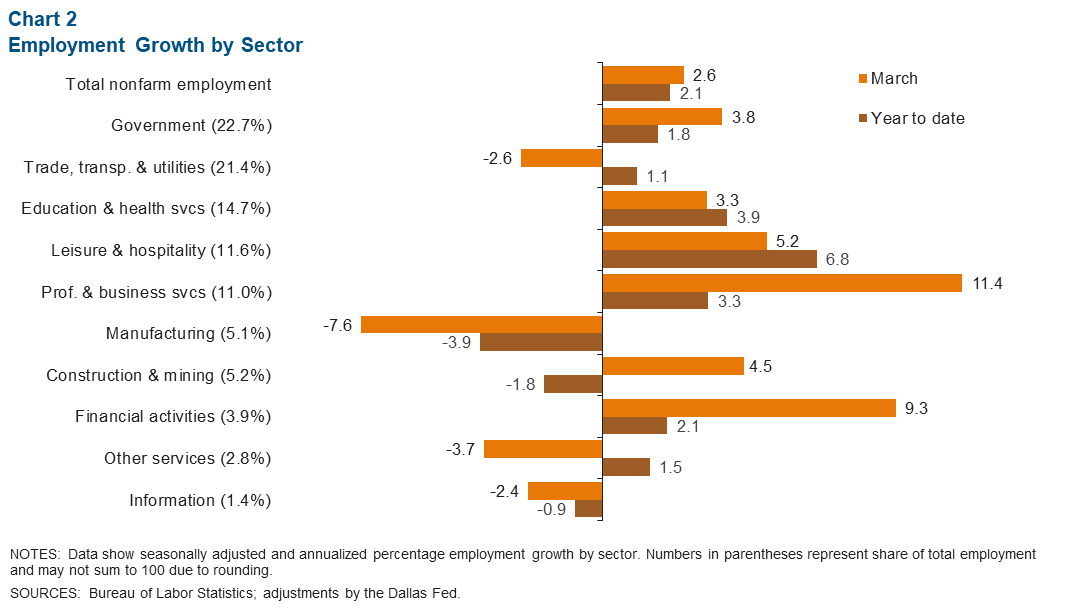
In March, El Paso employment expanded 2.6 percent, with most major sectors posting job gains (Chart 2). Year to date, El Paso jobs have grown 2.1 percent, adding 1,700 jobs. Gains in employment were driven by the major sectors. Government, the largest sector, rose 1.8 percent, boosted by 5.0 percent growth in federal government jobs. Leisure and hospitality has posted the fastest growth year to date, up 6.8 percent.
In March, El Paso’s unemployment rate stood at 3.9 percent, the lowest since 1990 when the series began. The El Paso rate was just above Texas and U.S. figures of 3.8 percent.
Housing Market
Annualized existing-home sales stood at 8,396 in March, up from February but down from the most recent peak of 8,882 seen in August 2018 (Chart 3). Meanwhile, the median home price rose to $157,694, up 2.4 percent from last year.
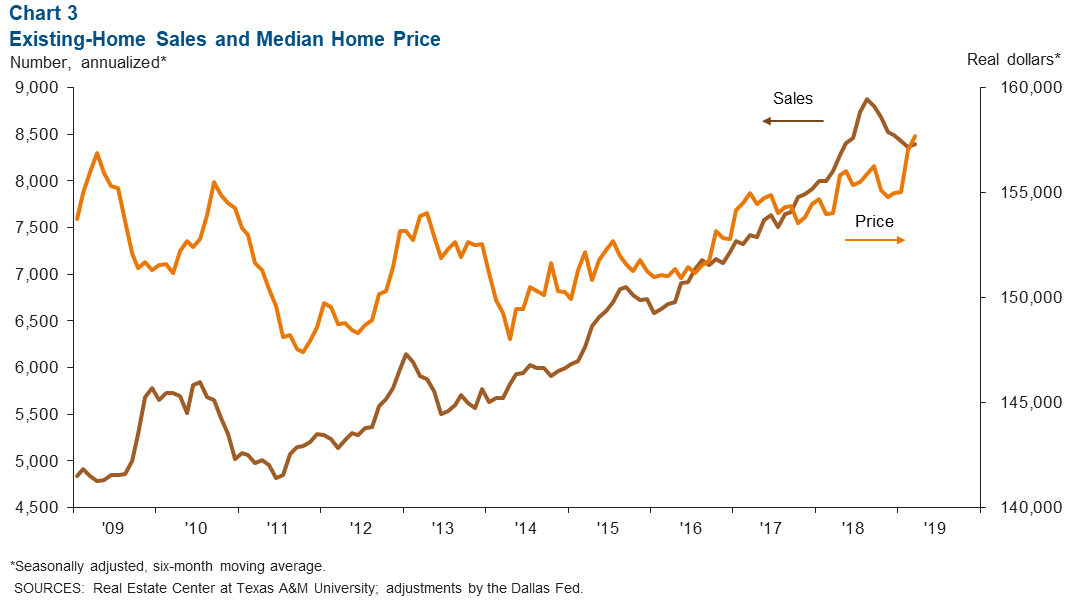
While home sales have slowed, inventories remain low. In March, inventories stood at 3.5 months, well below the six months considered a balanced market.
Trade
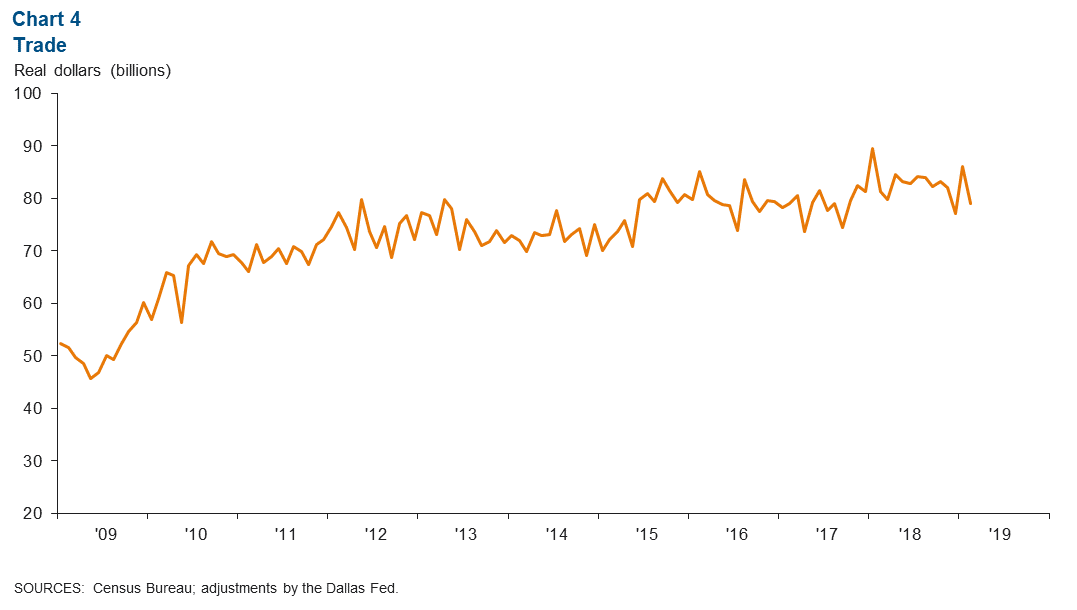
Annualized total trade through the El Paso Port of Entry totaled $79.0 billion in February, down 2.8 percent from a year ago (Chart 4). Total trade slowed due to declines in imports, which fell 5.1 percent over the year to $46.6 billion. Meanwhile, exports rose 0.8 percent over the year, totaling $32.4 billion.
Industrial Production and Maquiladora Activity
U.S. manufacturing conditions remain solid. U.S. industrial production rose 2.8 percent year over year in March (Chart 5). The Institute for Supply Management manufacturing index inched up from 54.2 in February to 55.3 in March; a reading above 50 signals expansion. U.S. and Mexican production and manufacturing trends are important to the local economy because of cross-border manufacturing relationships.
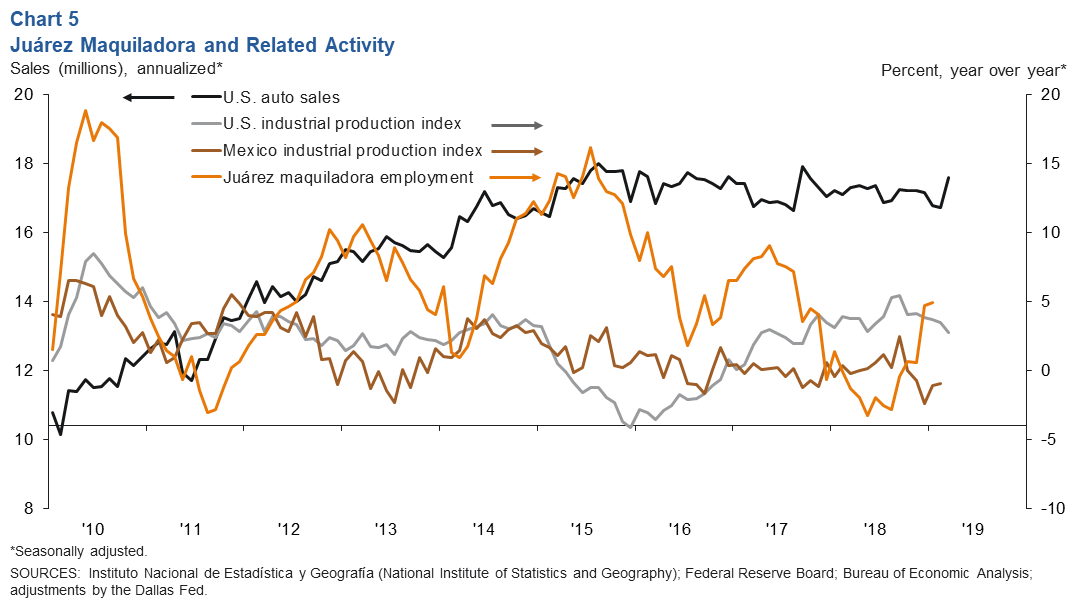
Across the border from El Paso, Ciudad Juárez maquiladora employment posted year-over-year growth in January. According to Mexico’s official series, maquiladora employment rose 4.9 percent in January to 283,267—an all-time high for Juárez maquiladora employment.
U.S. auto and light-truck production was 10.8 million units in March, below the 11.0 million units produced a year earlier. Meanwhile, monthly auto sales totaled 17.6 million, up from year-ago sales of 17.3 million. Auto sales are closely linked to the local economy because roughly half of maquiladoras in Juárez are auto related.
NOTE: Data may not match previously published numbers due to revisions. The El Paso metropolitan statistical area includes El Paso and Hudspeth counties.
About El Paso Economic Indicators
Questions can be addressed to Marycruz De León at marycruz.deleon@dal.frb.org. El Paso Economic Indicators is released on the fourth Wednesday of every month.