El Paso Economic Indicators

El Paso’s economy continues to expand. Jobs rose an annualized 1.1 percent in April. Despite the healthy labor market, population growth in El Paso has stalled. Maquiladora employment continues to climb, while trade has slowed.
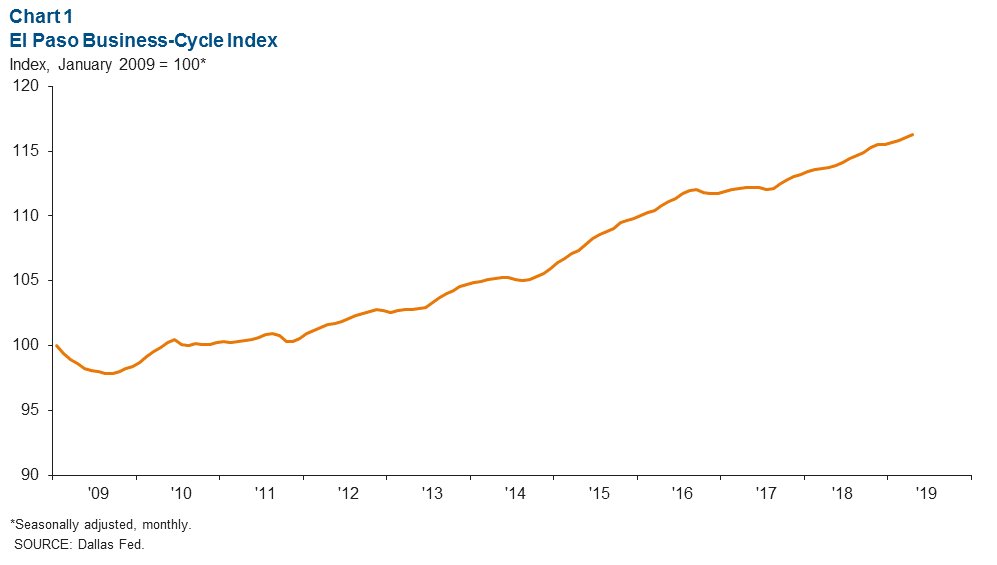
Business-Cycle Index
The El Paso Business-Cycle Index rose an annualized 2.5 percent in April (Chart 1). The rise in the index continued to be driven by gains in the job market.
Labor Market
Year to date, El Paso jobs expanded an annualized 1.9 percent, above El Paso’s long-term average of 1.5 percent (Chart 2). Most sectors have posted growth in 2019, but the largest gains have been in construction and mining, leisure and hospitality, and education and health services. Together, these three sectors account for nearly 75 percent of the 2,000 jobs added so far in 2019.
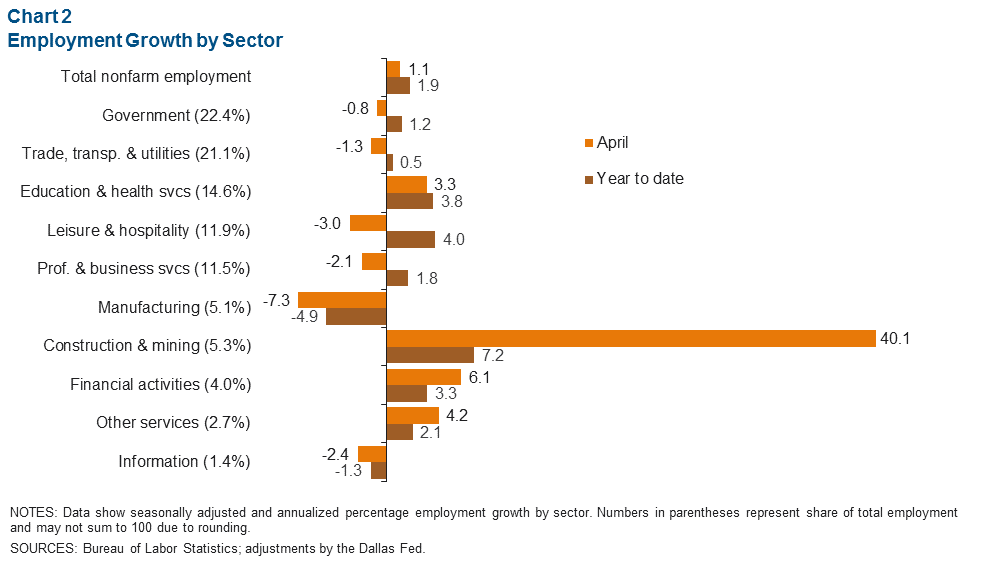
In April, the labor market tightened further, with unemployment dropping to its lowest level since 1990 (when the series began). The unemployment rate of 3.6 percent was on par with the U.S. rate and just below the state rate of 3.7 percent.
Population
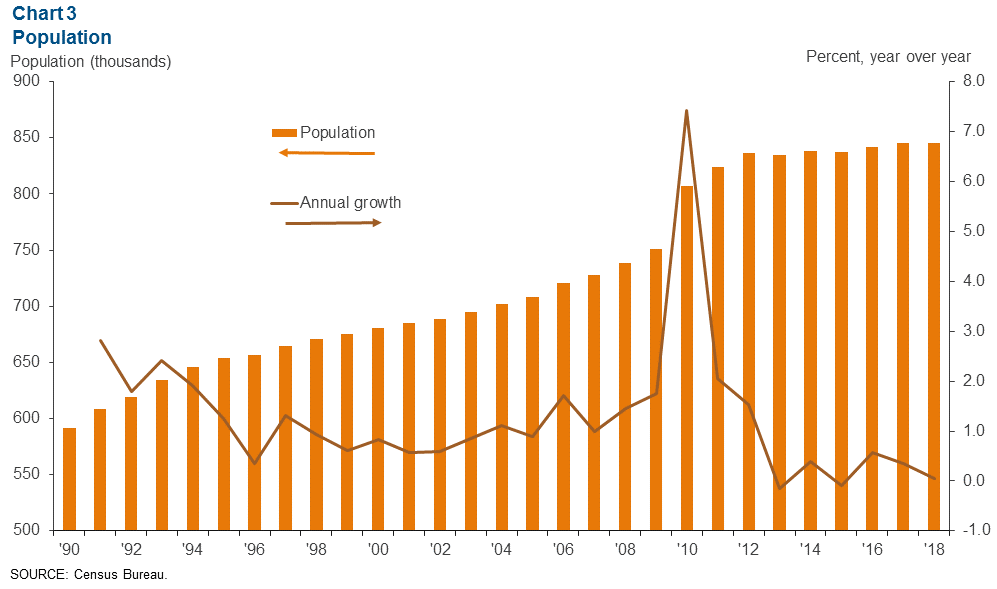
Recently released data from the Census Bureau estimate El Paso’s 2018 population at 845,553—barely above the metro’s 2017 population of 845,145 (Chart 3). The slow population growth was driven in large part by negative net migration. El Paso’s domestic outmigration (-8,153 people) far exceeded the positive international migration (1,604 people).
Trade
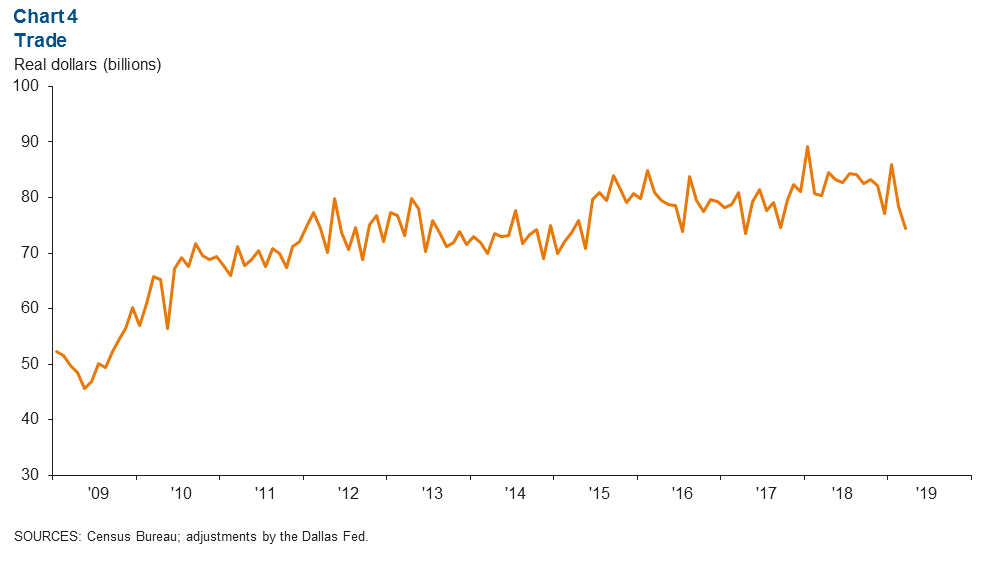
Annualized total trade through the El Paso Port of Entry totaled $74.5 billion in March, down 7.3 percent from a year ago (Chart 4). The slowdown in trade was due to declines in both imports and exports. Imports, which account for about 60 percent of total trade through the port, fell 9.8 percent to $45.3 billion. Meanwhile, exports declined 3.1 percent to $29.2 billion. The contraction in trade may be linked to the recent long delays at the border crossing due to customs and border protection officers being diverted to process migrants.
Industrial Production and Maquiladora Activity
U.S. industrial production grew 0.9 percent year over year in April (Chart 5). The Institute for Supply Management manufacturing index inched down to 52.8 in April from 55.3 in March. The reading remains above 50, which signals expansion. U.S. and Mexican production and manufacturing trends are important to the local economy because of cross-border manufacturing relationships.
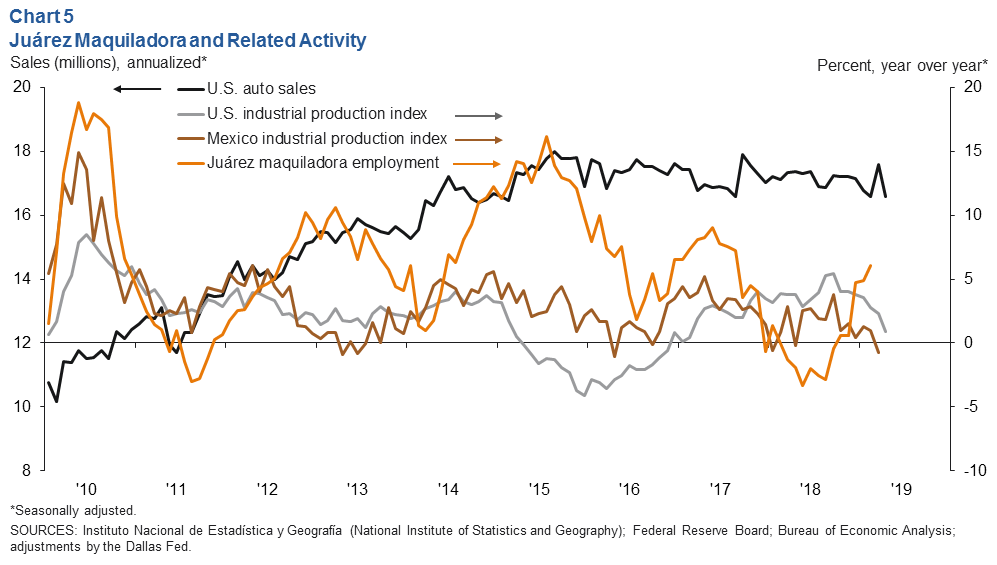
Across the border from El Paso, Juárez maquiladora employment expanded in February and continued to reach new highs. According to Mexico’s official series, maquiladora employment rose 6.1 percent year over year in February to an all-time high of 285,092.
U.S. auto and light-truck production was 10.2 million units in April, below the 11.1 units produced a year earlier. Meanwhile, monthly auto sales totaled 16.6 million, down from year-ago sales of 17.4 million. Auto sales are closely linked to the local economy because roughly half of maquiladoras in Juárez are auto related.
NOTE: Data may not match previously published numbers due to revisions. The El Paso metropolitan statistical area includes El Paso and Hudspeth counties.
About El Paso Economic Indicators
Questions can be addressed to Marycruz De León at marycruz.deleon@dal.frb.org. El Paso Economic Indicators is released on the fourth Wednesday of every month.