El Paso Economic Indicators

January 7, 2020
El Paso’s economic expansion continued into November of last year. Total nonfarm jobs grew at a 1.1 percent annualized rate year to date through November. Median home prices hit a 15-year high, while home sales slowed and inventories remained tight. Both U.S. and Mexico industrial production conditions continued to deteriorate, and U.S. auto production and sales growth was lackluster.
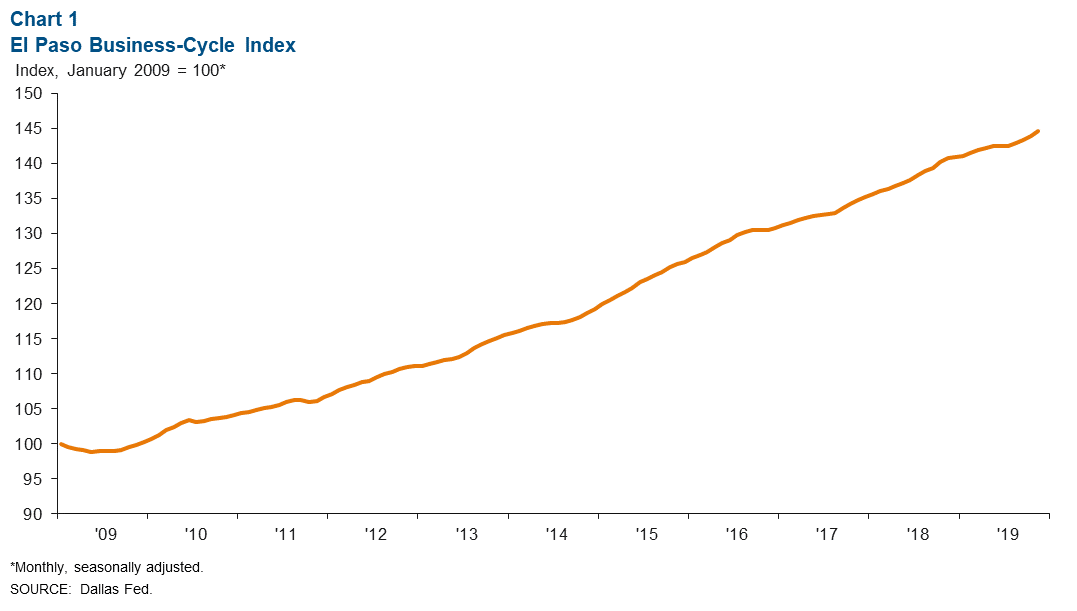
Business-Cycle Index
The El Paso Business-Cycle Index posted an annualized gain of 6.4 percent in November (Chart 1). The increase was primarily driven by employment growth and a near-historical low unemployment rate.
Labor Market
El Paso added an annualized 3,370 jobs to payrolls last year through November (Chart 2). Education and health services picked up the most jobs at 1,263. Other fast-growing sectors included construction and mining, manufacturing, and financial activities. Only trade, transportation and utilities experienced a decrease, declining at an annualized rate of 1.1 percent, or by 714 jobs.
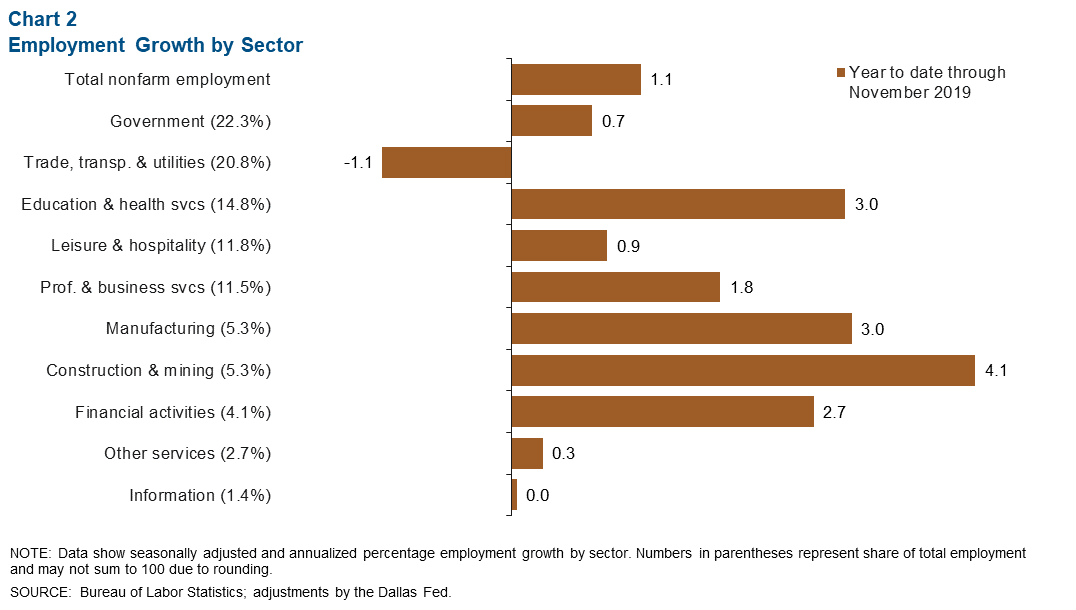
The El Paso unemployment rate dipped to 3.8 percent in November. The reading was slightly higher than the Texas rate of 3.4 percent and the U.S. rate of 3.5 percent.
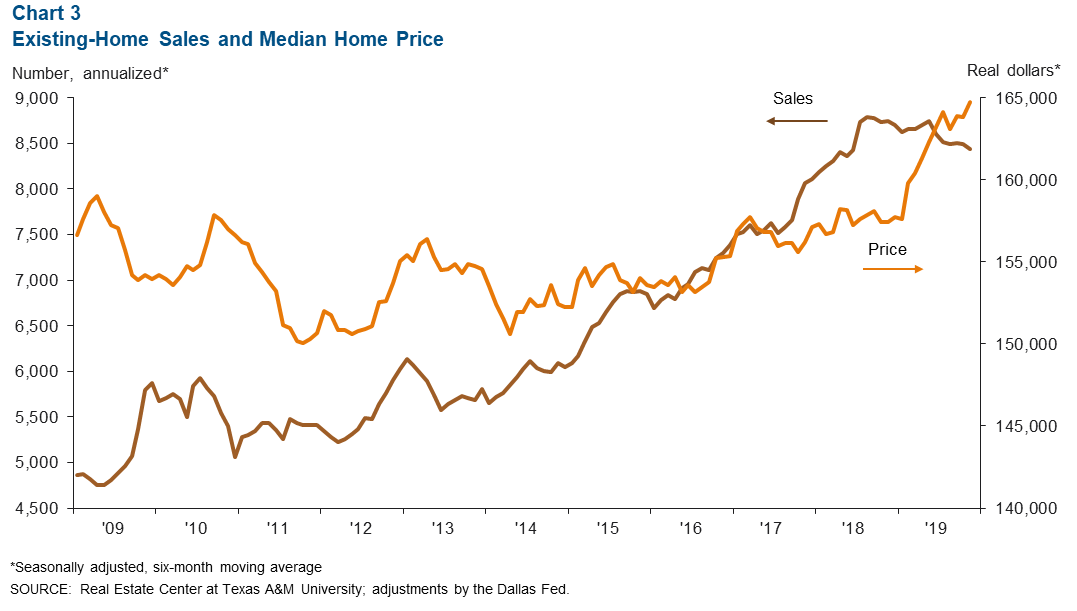
Housing Market
Year-to-date home sales in El Paso dropped for the fifth consecutive month in November (Chart 3). Annualized sales totaled 8,436, or 3.5 percent below the same period a year ago. Median home prices hit their highest level since 2005 at $164,769, up 4.7 percent from November 2018.
Meanwhile, existing-home inventories stood at 3.5 months in November, well below the six months of supply associated with a balanced market.
Trade
Annualized total trade in El Paso was $81 billion in October, down 3.2 percent from a year prior. Although imports improved in October, the year-over-year loss in total trade was driven by declines of 4.5 percent in exports and 2.3 percent in imports (Chart 4). Exports amounted to an annualized $32.4 billion, while imports equaled $48.5 billion.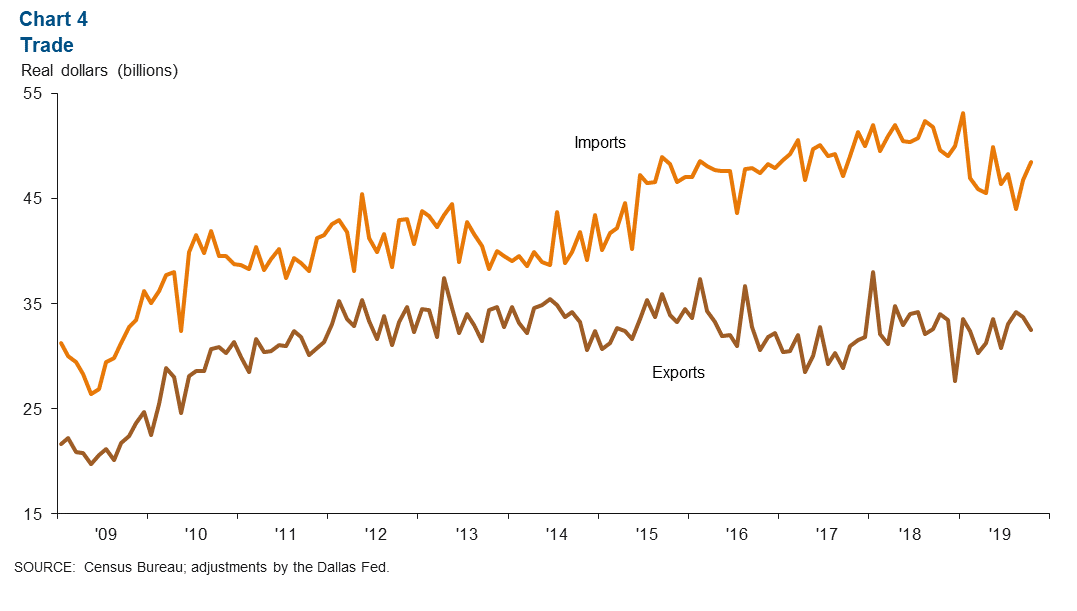
Industrial Production and Maquiladora Activity
U.S. industrial production contracted 0.8 percent year over year in November 2019 (Chart 5). Mexico industrial production continued to falter in October, declining 2.8 percent from a year earlier. Meanwhile, the U.S. Institute for Supply Management manufacturing index decreased 0.9 percentage points from November to 47.2 percent in December. This was the index’s lowest reading since June 2009, when it was 46.3 percent. U.S. and Mexican production and manufacturing trends are important to the local economy because of cross-border manufacturing relationships.
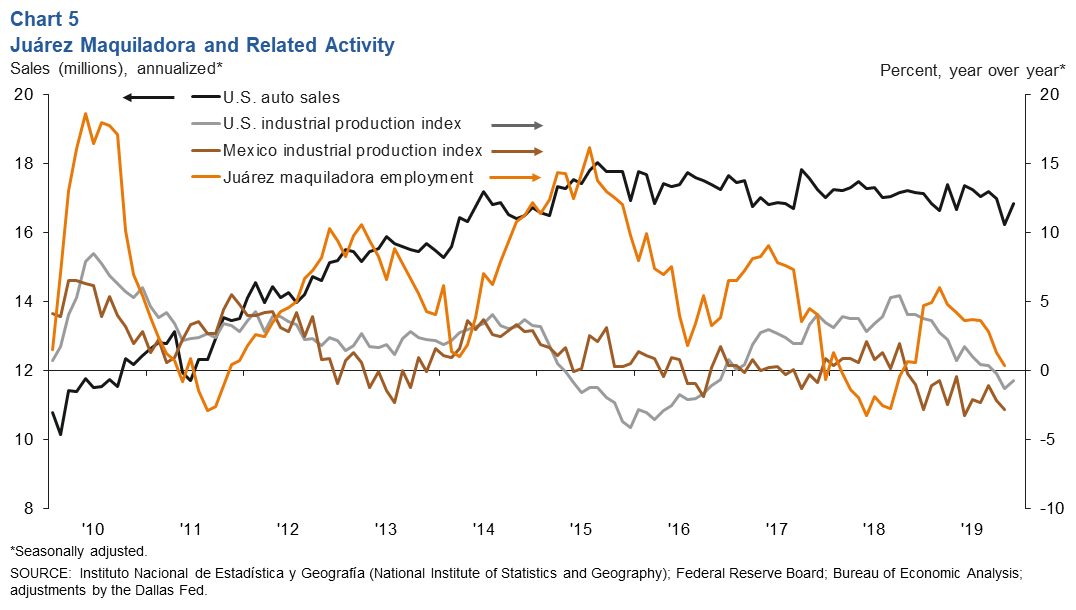
Year-over-year maquiladora employment in Juárez expanded in October, though at half of October 2018’s 12-month growth rate of 0.6. The increase was 0.3 percent, or 949 jobs, according to Mexico’s IMMEX series. However, monthly maquiladora employment weakened in October, down 715 jobs.
U.S. auto and light-truck production remained unchanged in November from a year earlier at 11.1 million units. Despite the month-to-month increase, U.S. auto sales fell 1.8 percent, from 17.2 million units in November 2018 to 16.8 million units in November 2019. Auto sales are closely linked to the local economy because roughly half of maquiladoras in Juárez are auto related.
NOTE: Data may not match previously published numbers due to revisions. The El Paso metropolitan statistical area includes El Paso and Hudspeth counties.
About El Paso Economic Indicators
Questions can be addressed to Keighton Allen at keighton.allen@dal.frb.org. El Paso Economic Indicators is released on the fourth Wednesday of every month.