El Paso Economic Indicators

January 30, 2020
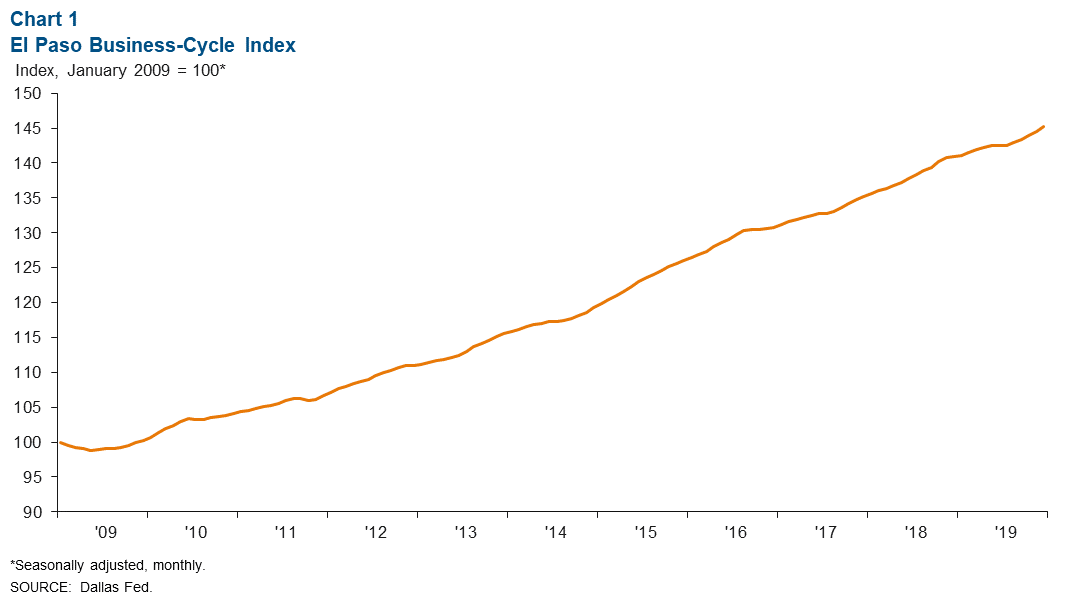
El Paso’s economy grew 1.1 percent in 2019, slower than the metro’s long-term average growth rate. Steady job gains boosted the business-cycle index. Monthly home sales strengthened, while median home prices reached a new high in December 2019. Industrial activity on both sides of the border continued to recede, and U.S. auto production and sales weakened further.
Business-Cycle Index
The El Paso Business-Cycle Index posted an annualized gain of 5.5 percent in December (Chart 1). The increase was supported by job growth and a near-historical-low unemployment rate.
Labor Market
El Paso payrolls expanded by 1.1 percent in 2019, below 2018’s growth of 1.8 percent (Chart 2). The slower growth was chiefly due to job losses in the trade and transportation sector and relatively anemic growth in the leisure and hospitality and professional and business services sectors. In contrast, El Paso’s largest sector, government, and its third-largest sector, education and health services, added 575 and 1,244 jobs, respectively. Job growth in construction and mining was solid as well at 3.8 percent (635 jobs). Overall, El Paso added 3,683 jobs in 2019.
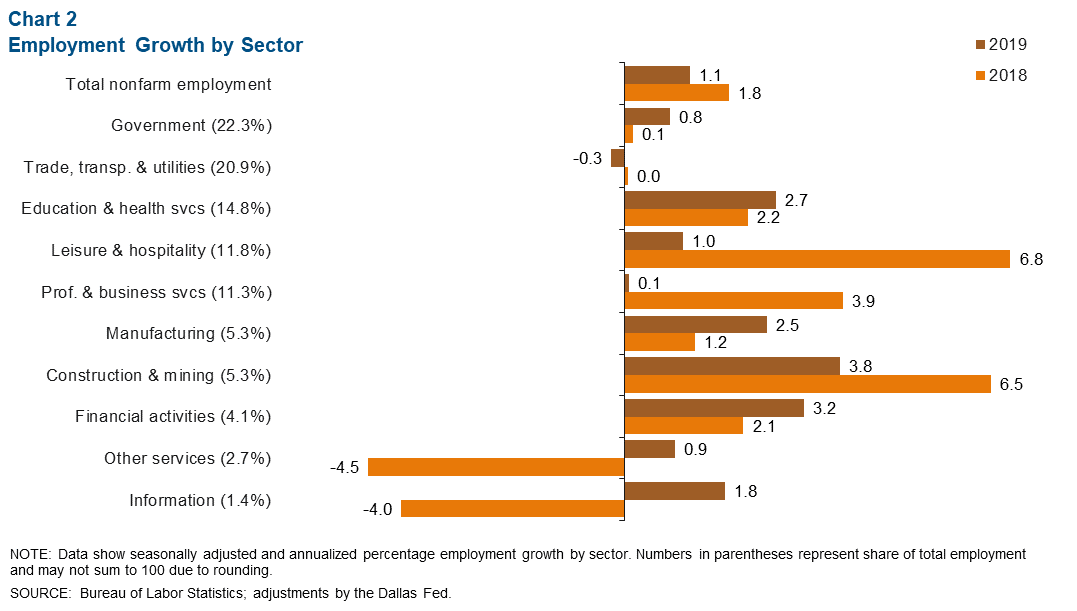
Solid payroll gains over the past few years have placed downward pressure on the El Paso unemployment rate. In December, the jobless rate was 3.7 percent, above the 3.5 percent rate for Texas and the U.S.
Housing Market
Home sales in El Paso totaled an annualized 8,663 units in December based on a six-month moving average, up 2.1 percent from November (Chart 3). Median home prices hit a 15-year high at $165,612 in December, appreciating 0.4 percent from the previous month.
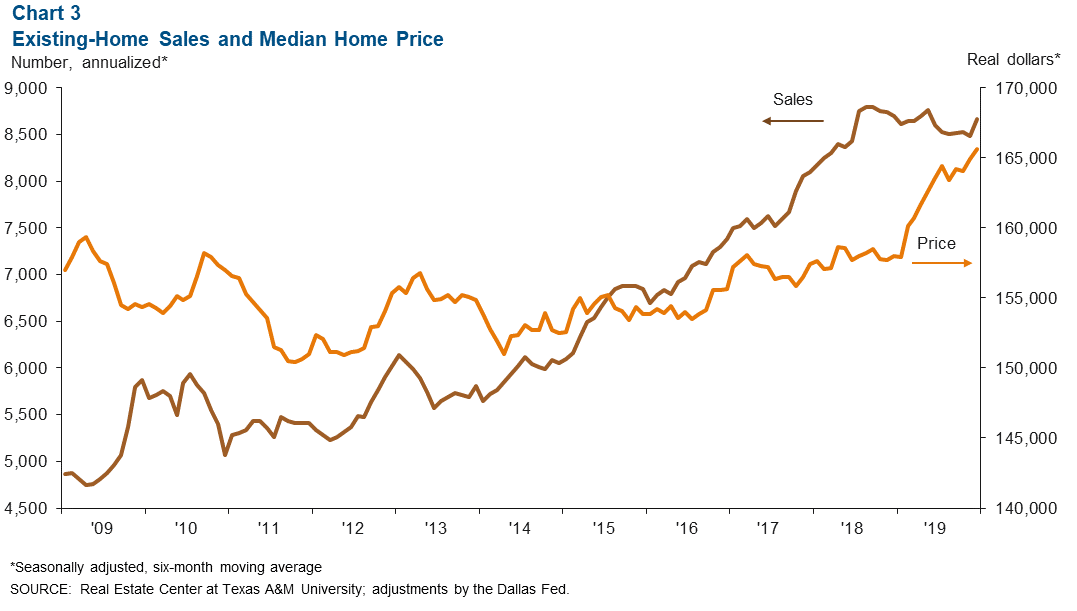
Existing-home inventories stood at 3.2 months in December, well below the six months of supply associated with a balanced market.
Trade
In November 2019, annualized trade through the port totaled $78.2 billion, down 6.0 percent from a year earlier (Chart 4). The loss was due to year-over-year declines of 12.3 percent for exports and 1.6 percent for imports. Exports amounted to an annualized $30.0 billion in November, while imports were an annualized $48.3 billion.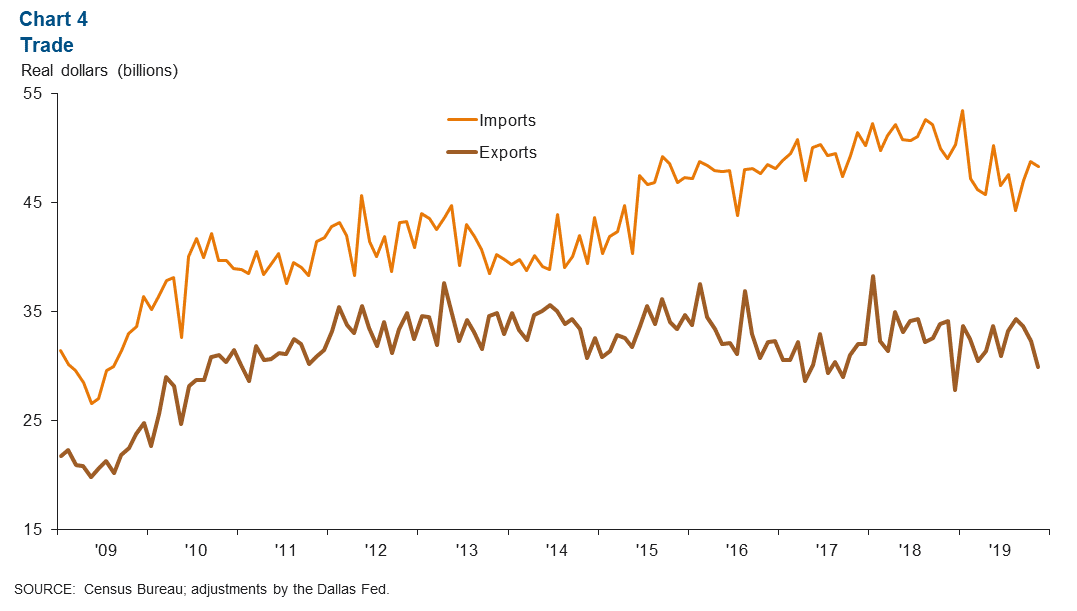
Industrial Production and Maquiladora Activity
U.S. industrial production (IP) contracted 1.0 percent in December 2019 compared with December 2018 (Chart 5). Although Mexico’s IP activity increased 0.8 percent from October to November, industrial activity decreased 1.7 percent from a year prior. Meanwhile, the U.S. Institute for Supply Management manufacturing index fell from 54.3 percent in December 2018 to 47.2 percent in December 2019. The deterioration in manufacturing activity was attributed to the slow pace of new orders, sluggish sales, trade uncertainty and weakness in export markets. U.S. and Mexican production and manufacturing trends are important to the local economy because of cross-border manufacturing relationships.
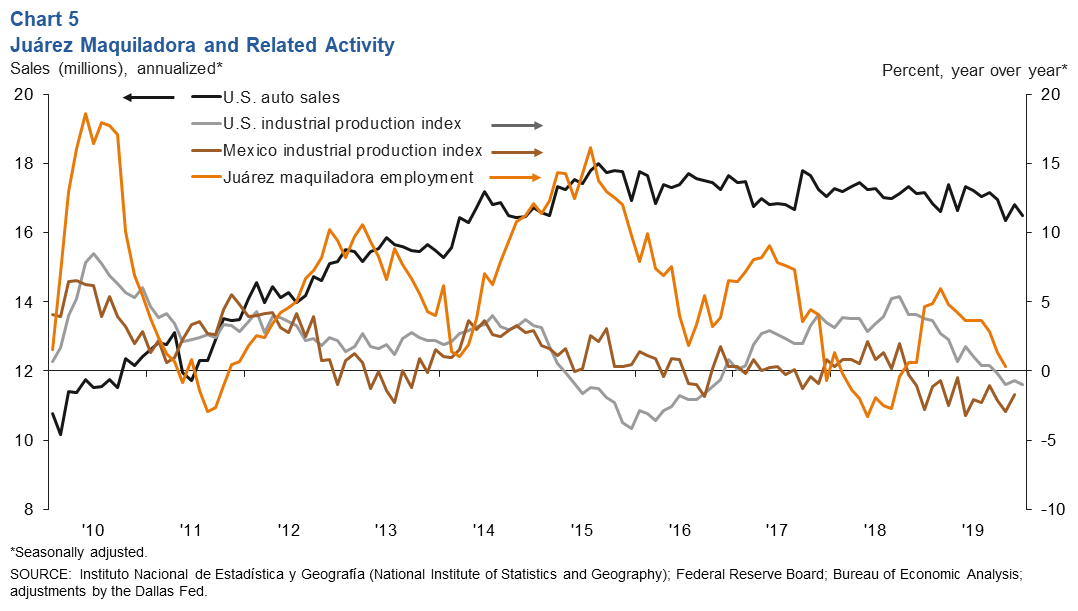
Juárez’s maquiladora employment declined year to date through October. According to Mexico’s IMMEX series, Juárez lost 3,130 manufacturing jobs over the first 10 months of 2019. This decline in employment may be the result of manufacturing plants reducing working hours to adjust inventories following the UAW strike at General Motors in October 2019. U.S. auto and light-truck production slumped 12.7 percent in December compared with a year earlier. U.S. auto sales fell 3.9 percent, from 17.2 million units in December 2018 to 16.5 million units in December 2019. Auto sales are closely linked to the local economy because roughly half of maquiladoras in Juárez are auto related.
NOTE: Data may not match previously published numbers due to revisions. The El Paso metropolitan statistical area includes El Paso and Hudspeth counties.
About El Paso Economic Indicators
Questions can be addressed to Keighton Allen at keighton.allen@dal.frb.org. El Paso Economic Indicators is released on the fourth Wednesday of every month.