El Paso Economic Indicators

May 5, 2020
El Paso’s economy contracted in March, as coronavirus (COVID-19) disruptions began to manifest. Initial unemployment claims surged from 335 at the beginning of March to a cumulative 38,225 in late April. U.S. and Mexico industrial and manufacturing conditions deteriorated drastically, while Juarez maquiladora employment weakened further, with 10,530 jobs lost since February 2019.
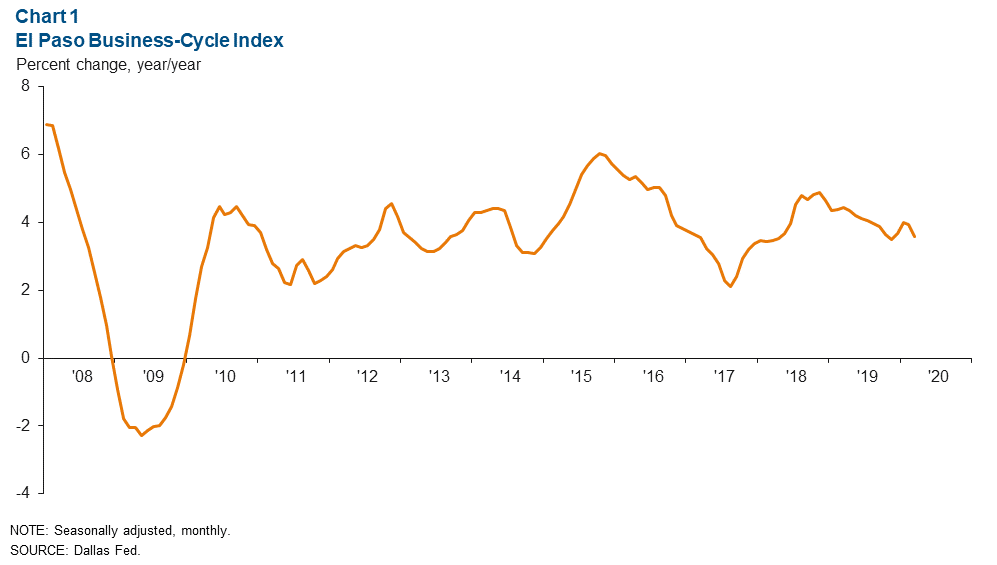
Business-Cycle Index
The El Paso Business-Cycle Index declined an annualized 0.5 percent from February to March (Chart 1). The drop in the index was driven by a weakened labor market and a rising unemployment rate.
Labor Market
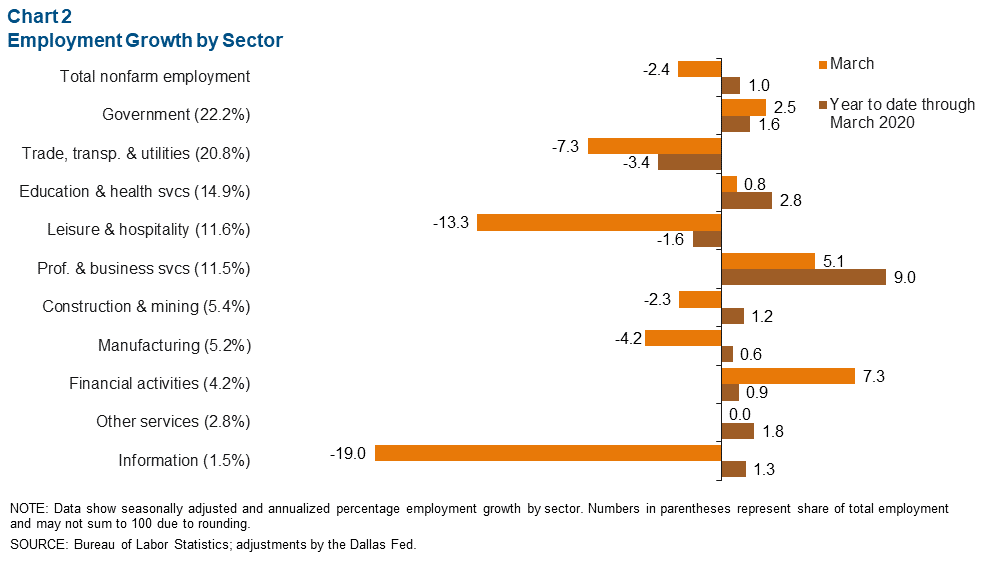
Payrolls Contract
In March, El Paso employment fell 2.4 percent, or a loss of 652 jobs (Chart 2). Trade, transportation and utilities, El Paso’s second-largest sector, contracted by 7.3 percent (-431 jobs), while the leisure and hospitality sector shrank by 13.3 percent (-458 jobs). Year to date, El Paso added 841 jobs, representing a 1.0 percent increase. Job gains since the beginning of 2020 have been mostly driven by professional and business services (807 jobs), education and health services (334 jobs) and government (283 jobs).
In March, El Paso’s unemployment rate increased to 4.8 percent. This was just above Texas’ rate of 4.7 percent and the U.S. figure of 4.4 percent.
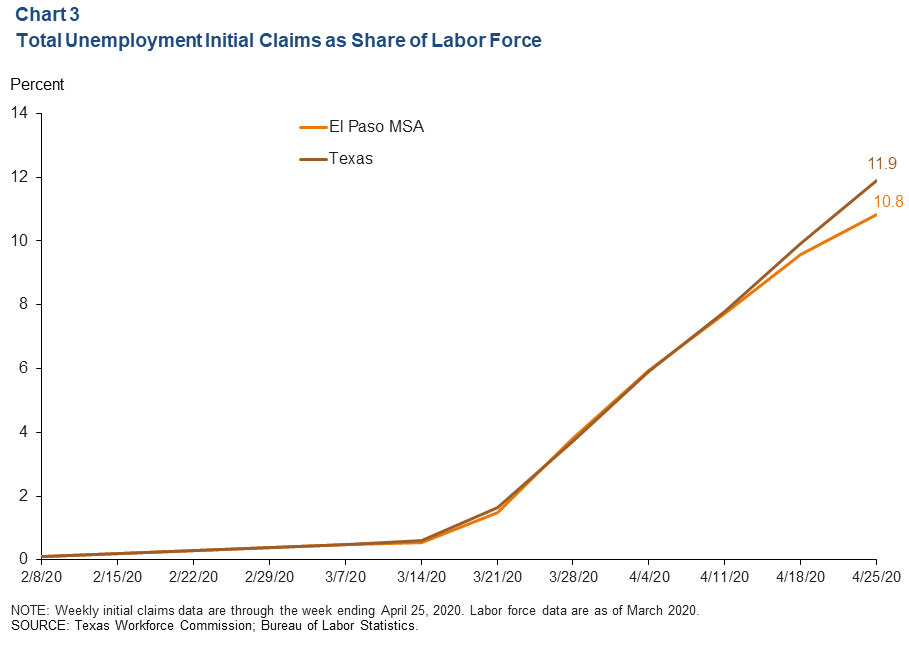
Unemployment Claims Soar
Initial claims for unemployment insurance benefits for the week ending April 25 were 4,606. Total initial claims filed since the beginning of February (39,620) represented 10.8 percent of the labor force in El Paso, slightly lower than the state’s 11.9 percent during the same period (Chart 3). For the week ending April 25, Texas’ total claims were 1.7 million.
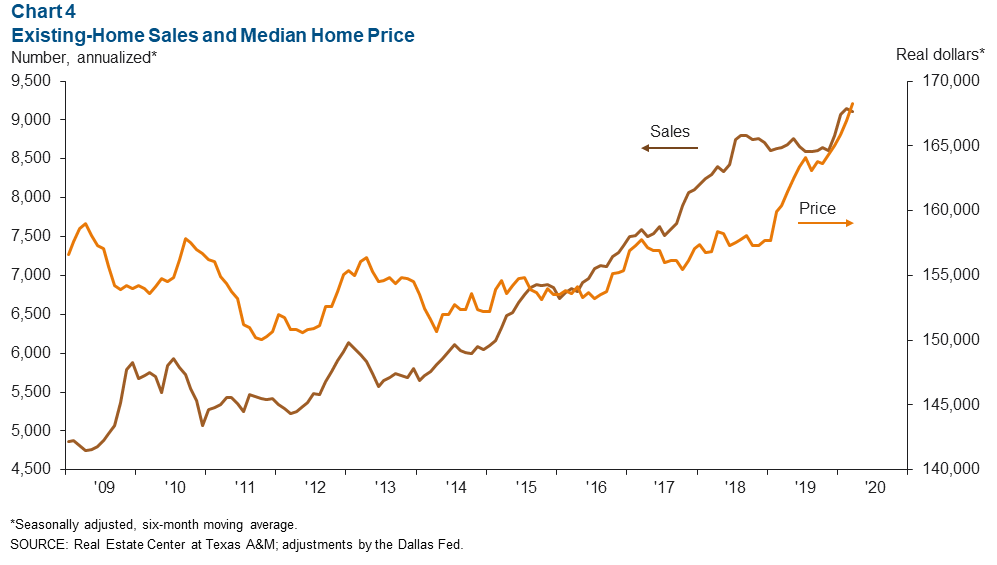
Housing Market
Annualized existing-home sales stood at 9,108 in March, down 0.4 percent from February but up 5.4 percent from a year prior (Chart 4). The median home price rose to $168,236, up 4.9 percent from last year. Existing-home inventories remained at 2.7 months in March, well below the six months associated with a balanced market.
Industrial Production and Maquiladora Activity
U.S. industrial production decreased 5.5 percent year over year in March (Chart 5). Meanwhile, Mexico’s industrial production index in February fell 3.5 percent from a year prior. The Institute for Supply Management manufacturing index inched down from 50.1 in February to 49.1 in March. Respondents cited the COVID-19 pandemic and energy market volatility as reasons for the contraction. U.S. and Mexican production and manufacturing trends are important to the local economy because of cross-border manufacturing relationships.
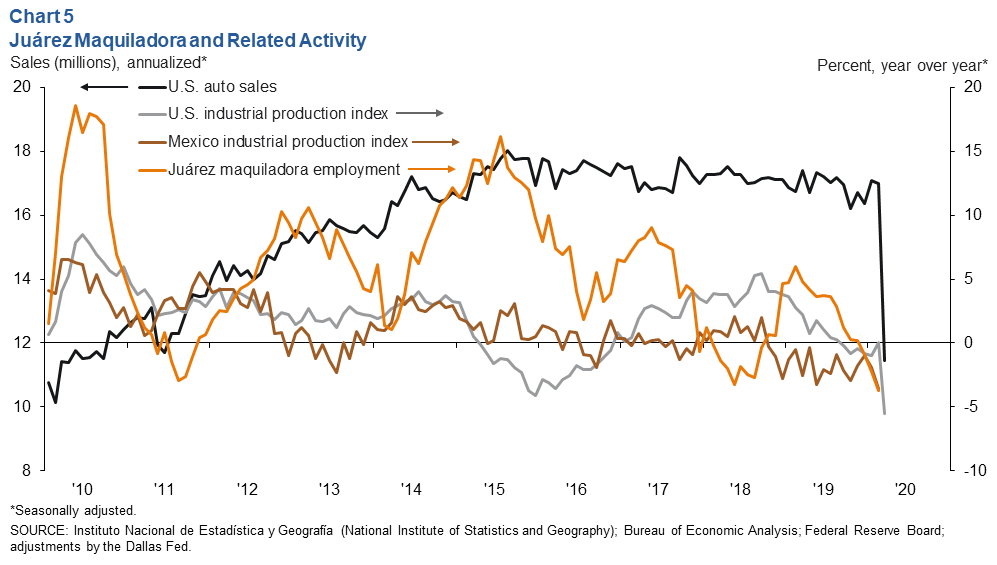
Juárez’s year-over-year maquiladora employment in February fell 3.7 percent, or a loss of 10,530 manufacturing jobs. U.S. auto and light-truck production was 7.2 million units in March, the lowest production figure since November 2009 and 33.5 percent below the 10.8 million units produced a year earlier. Meanwhile, monthly auto sales totaled 11.5 million, the lowest sales number since May 2010 and 34.1 percent below sales of 17.4 million a year prior. Auto sales are closely linked to the local economy because roughly half of maquiladoras in Juárez are auto related.
NOTE: Data may not match previously published numbers due to revisions. The El Paso metropolitan statistical area includes El Paso and Hudspeth counties.
About El Paso Economic Indicators
Questions can be addressed to Keighton Allen at keighton.allen@dal.frb.org. El Paso Economic Indicators is released on the fourth Wednesday of every month.