El Paso Economic Indicators

February 3, 2021
The El Paso Business-Cycle Index signaled further expansion in the metro, though total nonfarm job growth was flat in December. Housing sales continued to strengthen, which tightened inventories and pushed prices up further. Trade volumes remained depressed, but industrial activity on both sides of the border accelerated.
Business-Cycle Index
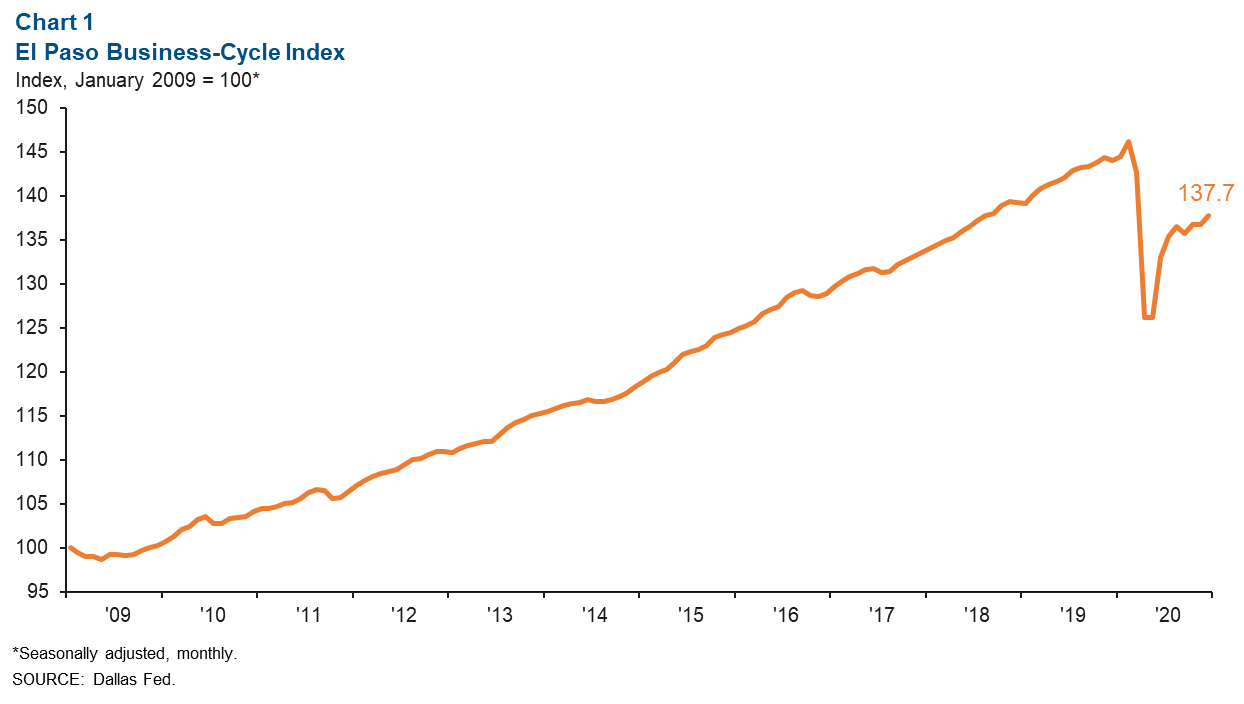
The El Paso Business-Cycle Index increased an annualized 9.4 percent in December to 137.7, a quicker pace than November’s annualized growth rate of 0.1 percent. From February to December, the index fell an annualized 6.9 percent (Chart 1).
Labor Market
El Paso payrolls stayed roughly the same size from November to December (Chart 2). The area’s largest sector—trade, transportation and utilities—added 730 jobs (nonannualized), and government gained 100 jobs. However, employment gains were offset by losses in manufacturing (-360 jobs), leisure and hospitality (-230), and financial activities (-165).
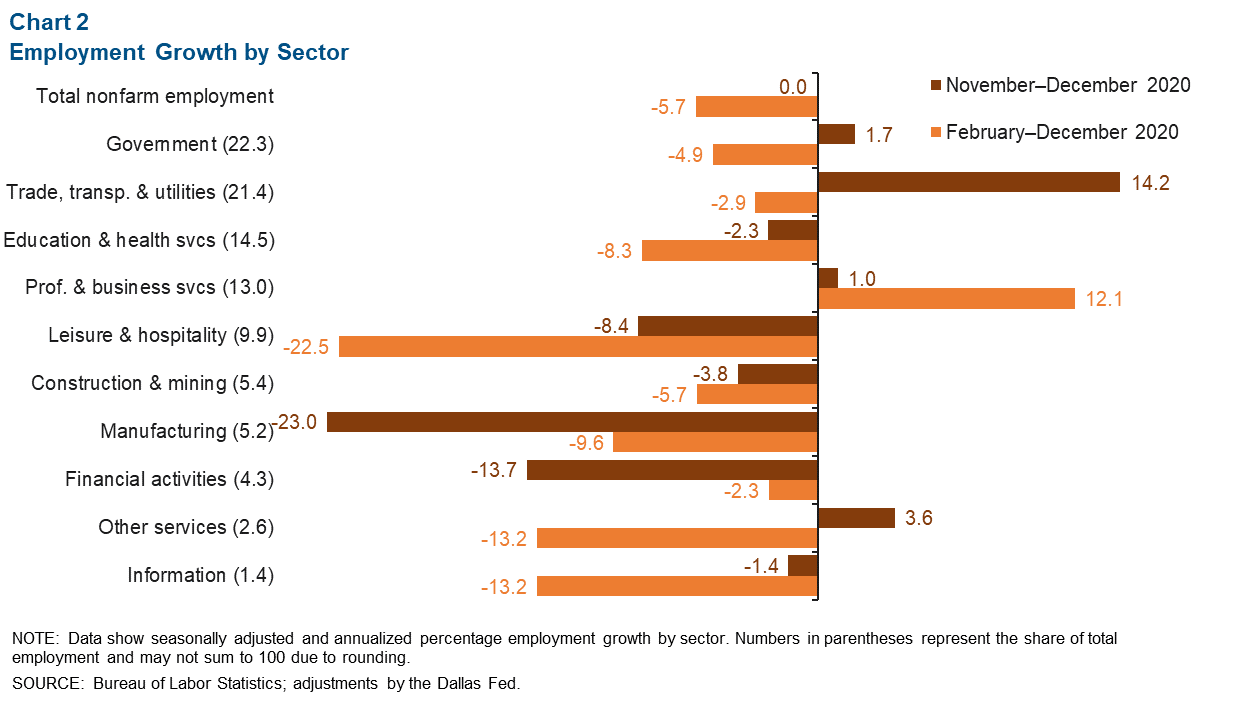
Between February and December, the El Paso labor market lost over 15,720 jobs (nonannualized). Only professional business services saw gains, adding nearly 3,650 jobs over the previous 10 months. Job losses since February were widespread in leisure and hospitality (-7,240), education and health services (-3,370), government (-2,980), trade, transportation and utilities (-1,680), manufacturing (-1,430 jobs) and other services (-1,010).
El Paso’s unemployment rate fell from 9.7 to 8.4 percent in December. The unemployment rate in Texas also fell from 8.1 to 7.2 percent, while the nation’s jobless rate held steady at 6.7 in December.
Housing Market
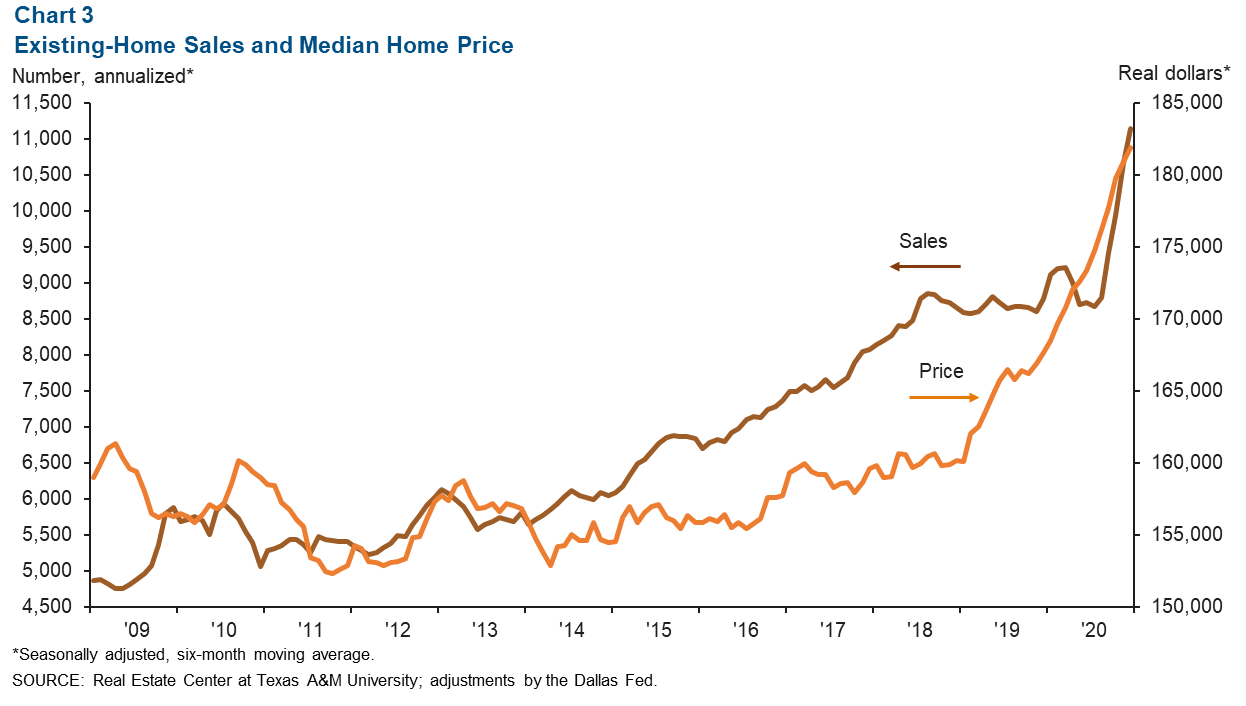
El Paso existing-home sales grew 27.1 percent (annualized) to 11,151 from December 2019 to December 2020 (Chart 3). Housing inventories stood at 1.6 months, well below the six months considered a balanced market. With low inventory, home-price growth has strengthened. The median home price was $181,878 at the end of 2020, up 8.5 percent from 2019.
Trade
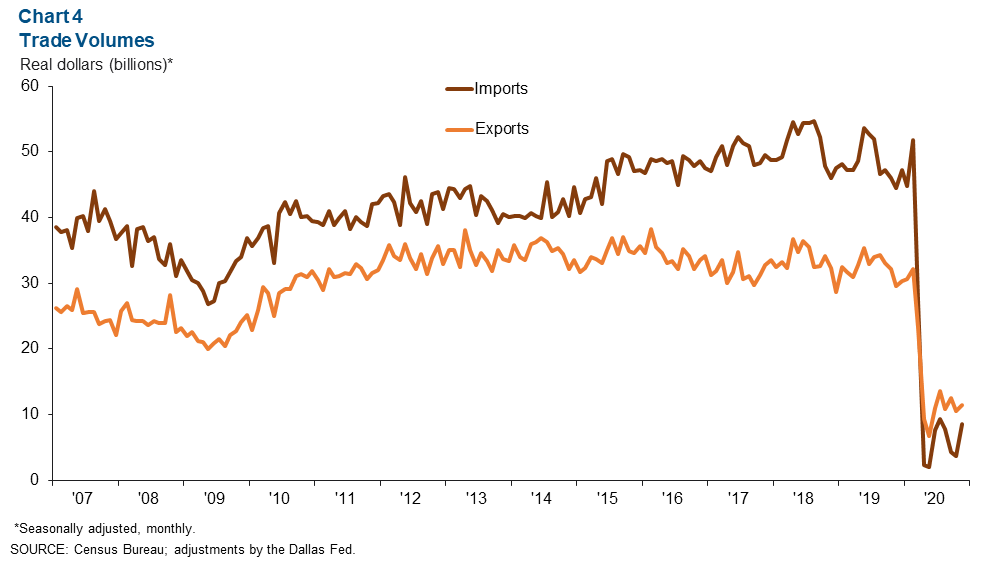
Annualized trade in El Paso totaled $19.9 billion in November, down 73.1 percent from $74.0 billion a year earlier (Chart 4). Diminished imports and exports contributed to the drop in trade volumes. Imports totaled $8.5 billion in November, a year-over-year decrease of 80.9 percent, while exports totaled $11.4 billion, a decline of 61.4 percent.
Industrial Production and Maquiladora Activity
The monthly U.S. industrial production index rose from 104.1 to 105.7 in December but was down 3.6 percent on a year-over-year basis (Chart 5). Mexico’s industrial production index also grew on a monthly basis in November, from 96.9 to 97.9, but was down 3.3 percent compared with a year prior. The Institute for Supply Management manufacturing index was 58.7 in January, down from December’s figure of 60.5. January’s figure indicates continued expansion in the manufacturing sector for the eighth month in a row, as it is over the threshold of 50.
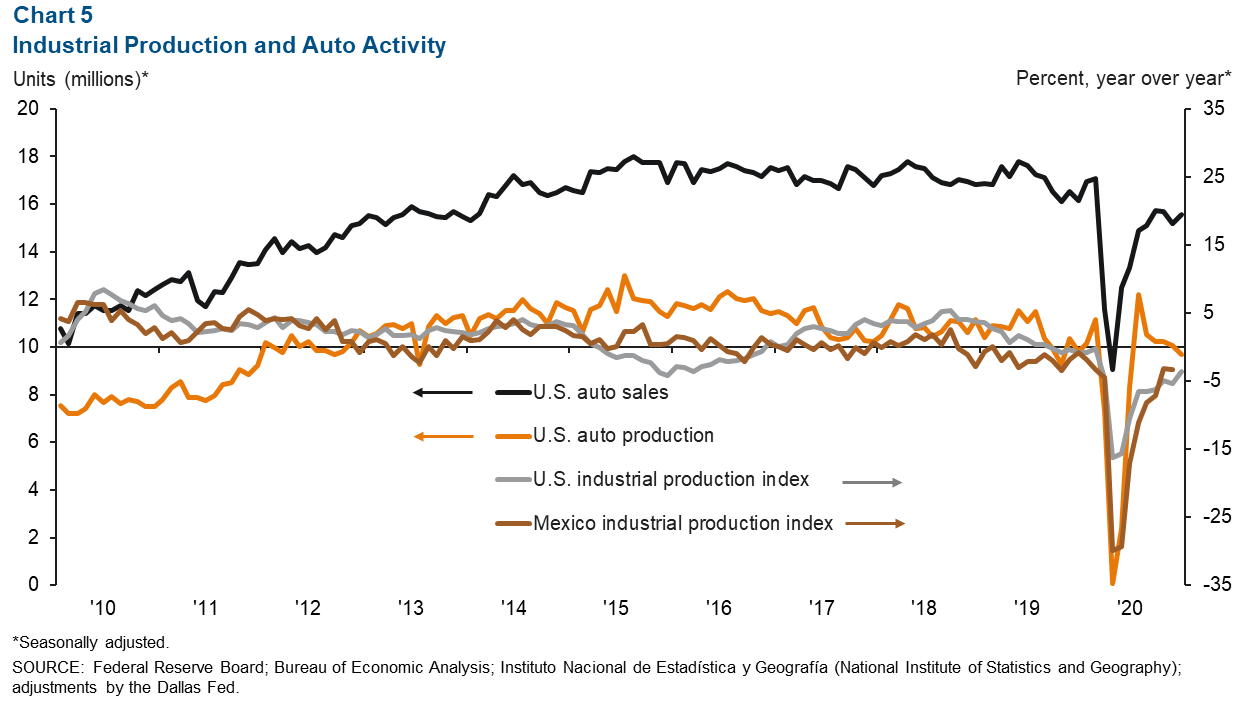
U.S. auto and light-truck production fell from 10.1 million units in November to 9.7 million units in December and was 1.3 percent lower than the 9.8 million units in December 2019. Meanwhile, monthly auto sales rose in December, totaling 15.6 million, but were 3.5 percent lower than a year prior. Auto sales are closely linked to the local economy because roughly half of maquiladoras in Juárez are auto related.
NOTE: Data may not match previously published numbers due to revisions. The El Paso metropolitan statistical area includes El Paso and Hudspeth counties.
About El Paso Economic Indicators
Questions can be addressed to Keighton Hines at keighton.hines@dal.frb.org. El Paso Economic Indicators is released on the fourth Wednesday of every month.