El Paso Economic Indicators

August 26, 2021
The El Paso economy continued its recovery from the pandemic-induced recession in July. The business-cycle index expanded, employment levels rose and the unemployment rate fell. However, August high-frequency data showed slowing mobility and consumer spending. Growth in manufacturing activity slowed and auto sales slipped.
Business-Cycle Index
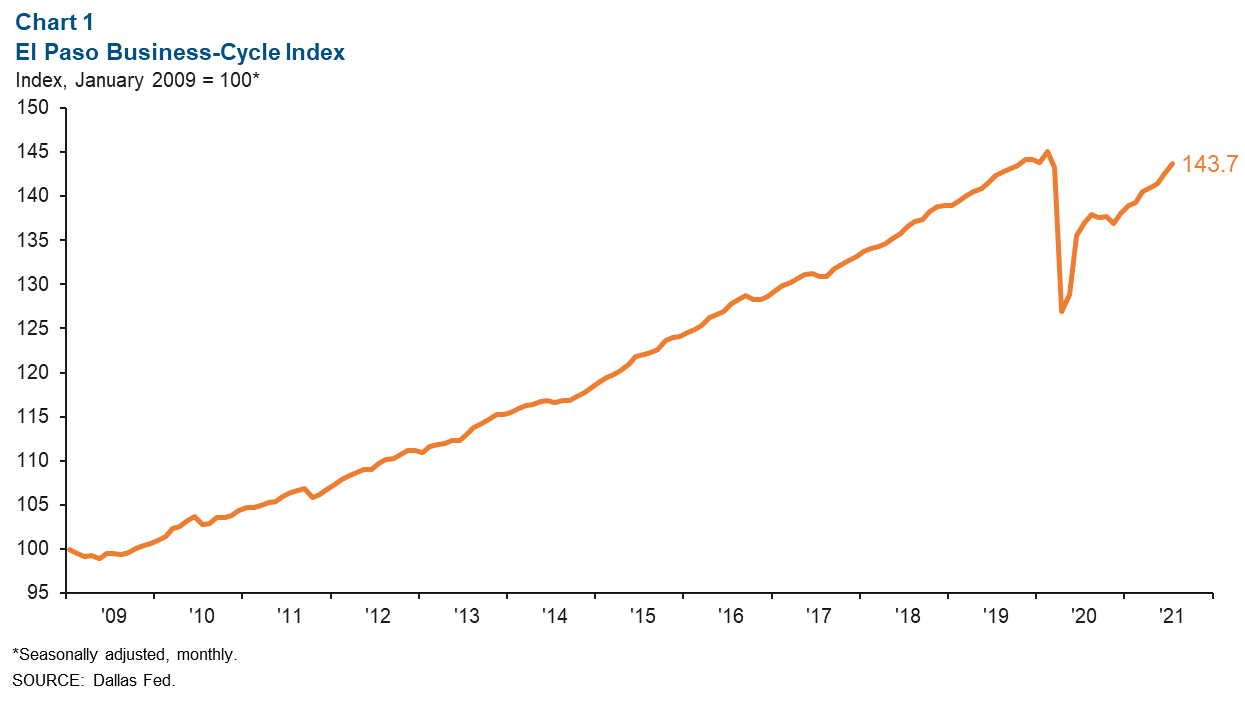
The El Paso Business-Cycle Index rose an annualized 9.9 percent in July, buoyed by job gains and a decline in the unemployment rate (Chart 1). Compared with prepandemic levels (February 2020), the index is down 1.0 percent.
Labor Market
In July, El Paso employment expanded an annualized 6.7 percent, or by 1,723 jobs (Chart 2). Gains were largely driven by government (1,711 jobs), leisure and hospitality (293) and trade, transportation and utilities (202). Sectors that shrank included manufacturing (-317 jobs) and professional and business services (-275).
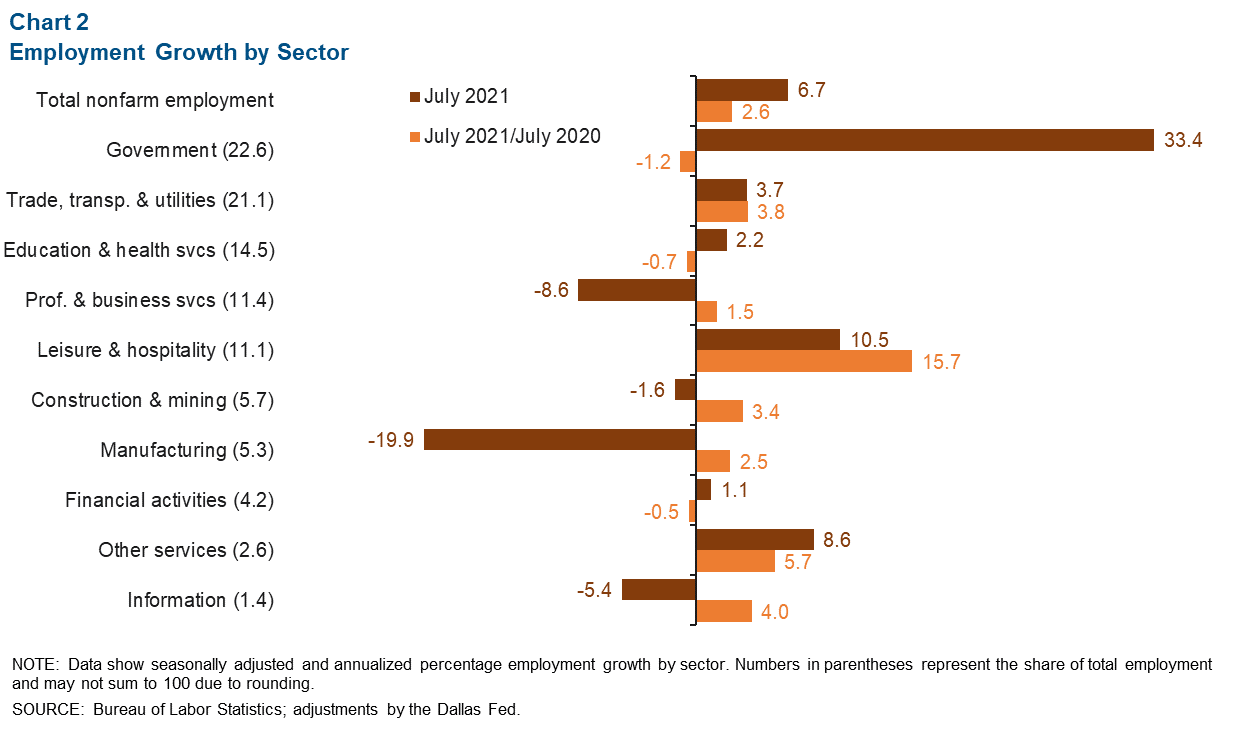
Year over year in July, El Paso payrolls were up 2.6 percent (8,186 jobs). Sectors that experienced job growth included leisure and hospitality (4,811 jobs) and trade, transportation and utilities (2,435). The metro’s largest sector, government, saw employment losses during this period (-844 jobs), as did education and health services (-322).
El Paso’s seasonally adjusted unemployment rate fell from 6.7 percent in June to 6.3 percent in July. The jobless rate in Texas fell from 6.5 to 6.2 percent, while the U.S. figure declined from 5.9 to 5.4 percent.
Google Community Mobility Report
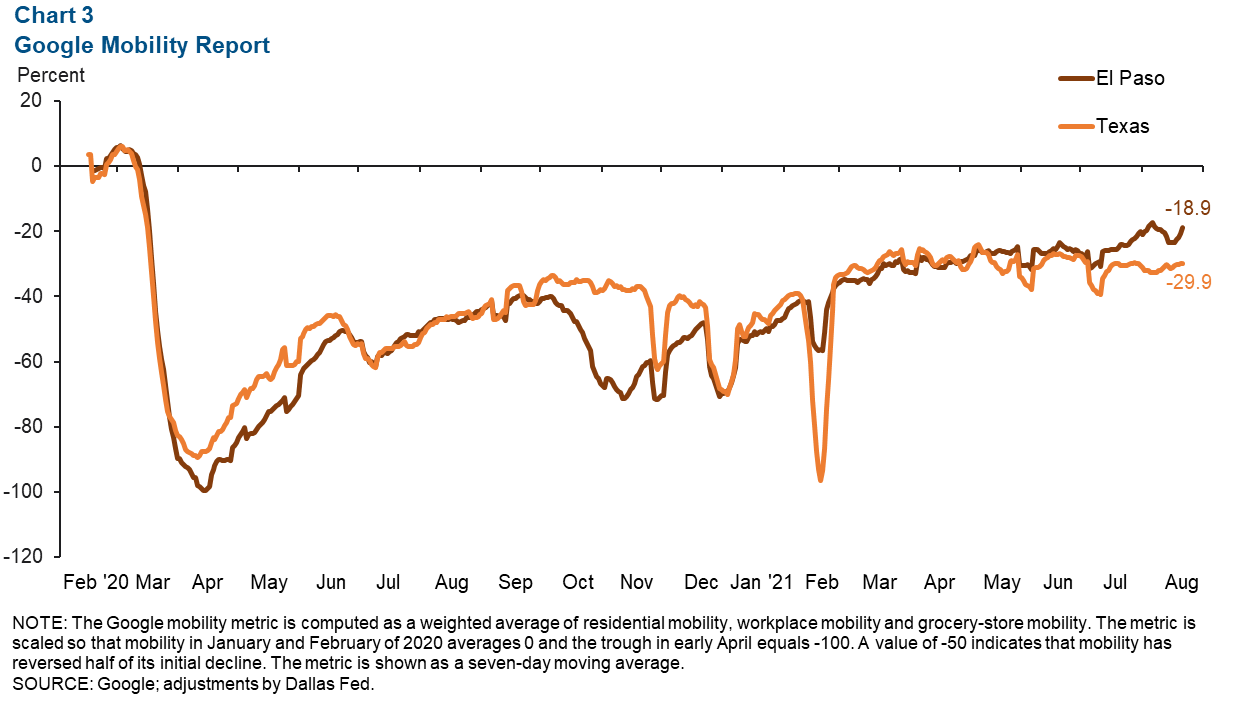
Google mobility data for El Paso County showed signs of slowing in August. El Paso County mobility fell from -17.3 percent in early August to -18.9 percent on Aug. 21, while Texas mobility was down almost 30 percent compared with prepandemic levels (Chart 3). This may be due to a combination of seasonal factors and the latest surge in COVID-19 cases.
Consumer Spending
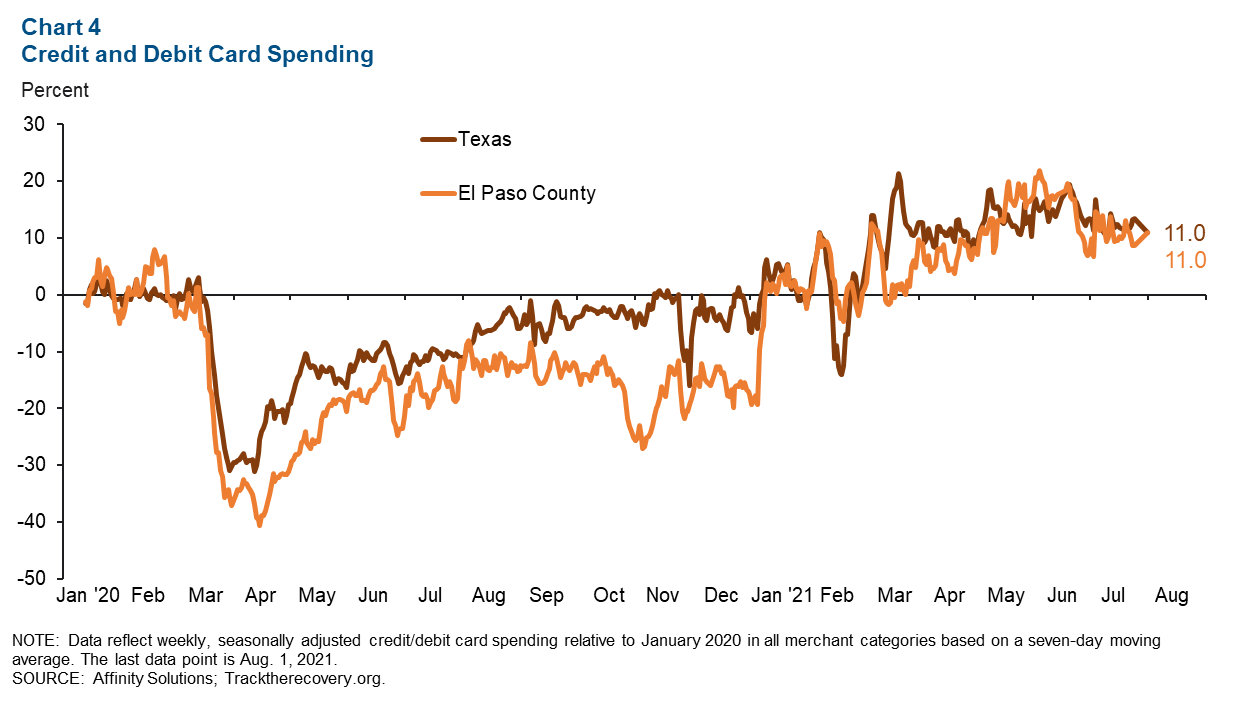
El Paso County consumer spending (as measured by credit and debit card spending) remains above prepandemic spending levels, although it has trended downward since its recent peak of 21.9 percent on June 4 (Chart 4). As of Aug. 1, spending was up 11.0 percent from January 2020 in both the county and the state.
Industrial Production and Maquiladora-Related Activities
The monthly U.S. industrial production index rose from 100.2 in June to 101.1 in July and was up 6.6 percent from a year ago (Chart 5). Mexico’s industrial production index fell from 98.3 in May to 97.8 in June but was 13.6 percent higher than a year prior. The Institute for Supply Management (ISM) manufacturing index ticked down from June’s 60.6 reading to 59.5 in July but was up 10.8 percentage points from a year ago. Comments from ISM panelists indicated that long raw-material lead times, material shortages, rising commodities prices, transportation issues, worker absenteeism and hiring difficulties were making it difficult to meet increased demand.
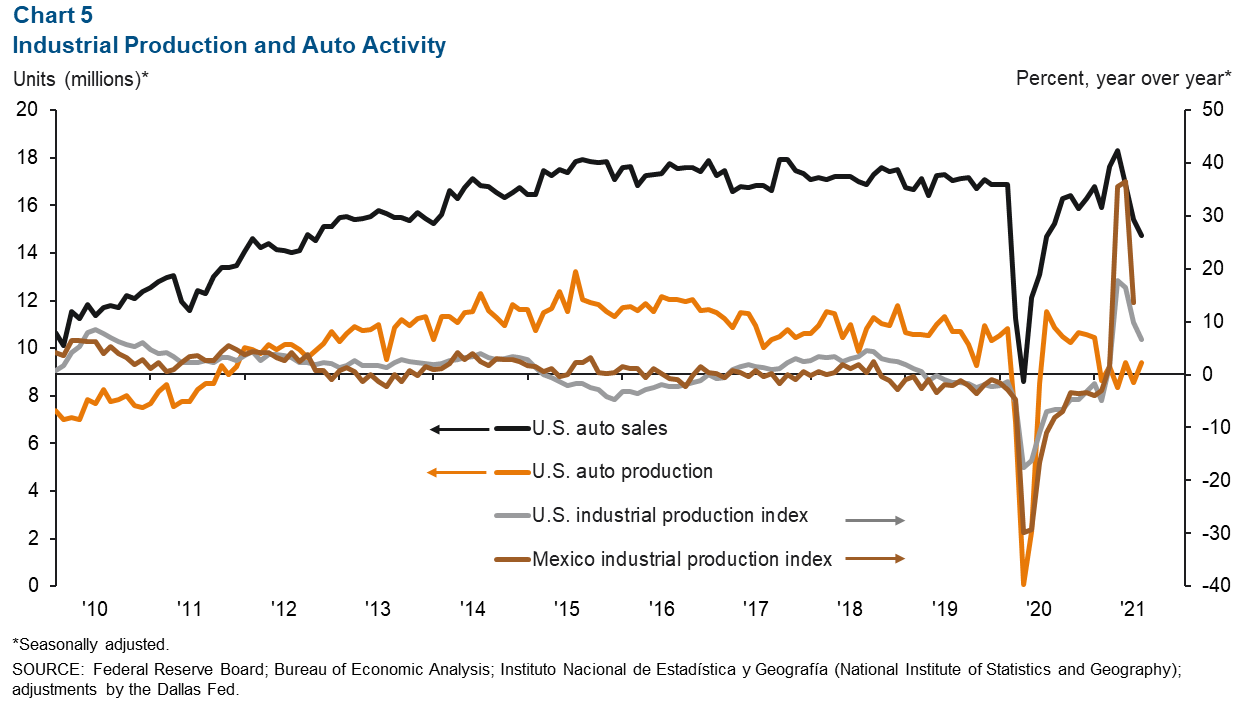
U.S. auto and light-truck production grew from 8.6 million units in June to 9.4 million units in July. Monthly auto sales fell from 15.4 million in June to 14.8 million in July. Industrial and auto activity are closely linked to the El Paso-area economy because of cross-border manufacturing relationships. Roughly half of maquiladoras in Juárez are auto related.
NOTE: Data may not match previously published numbers due to revisions. The El Paso metropolitan statistical area includes El Paso and Hudspeth counties.
About El Paso Economic Indicators
Questions can be addressed to Keighton Hines at keighton.hines@dal.frb.org. El Paso Economic Indicators is published every month after state and metro employment data are released.