El Paso Economic Indicators

September 22, 2022
El Paso’s rapid economic growth slowed in August as the business-cycle index fell for the first time in almost two years and payrolls contracted across sectors. Unemployment declined, and northbound border crossings through the El Paso customs district continued to rise. Auto production and manufacturing activity were subdued in August.
Business-cycle index
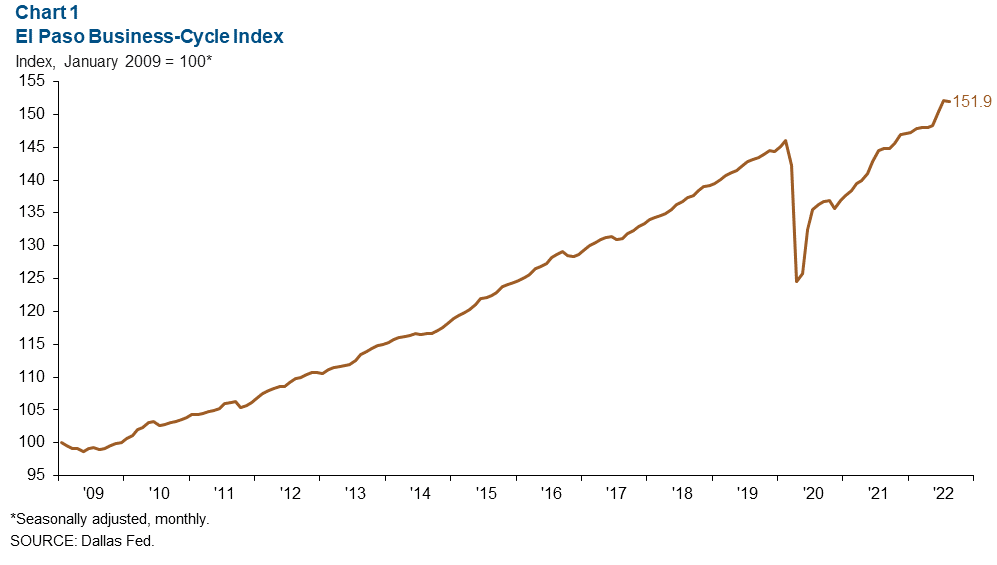
El Paso’s Business-Cycle Index fell in August to 151.9, an annualized 1.4 percent decrease from the previous month (Chart 1). The index is up 4.9 percent year to date.
Labor market
Most employment sectors decline
Total nonfarm payroll employment shrank 6.3 percent (-1,794 jobs) from July to August (Chart 2). Most El Paso sectors experienced job losses, signaling a slowing local economy. Employment contracted in two of the area’s largest sectors―government by 842 jobs, and professional and business services by 601. The only industries with gains were education and health services (170 jobs) and other services (12).
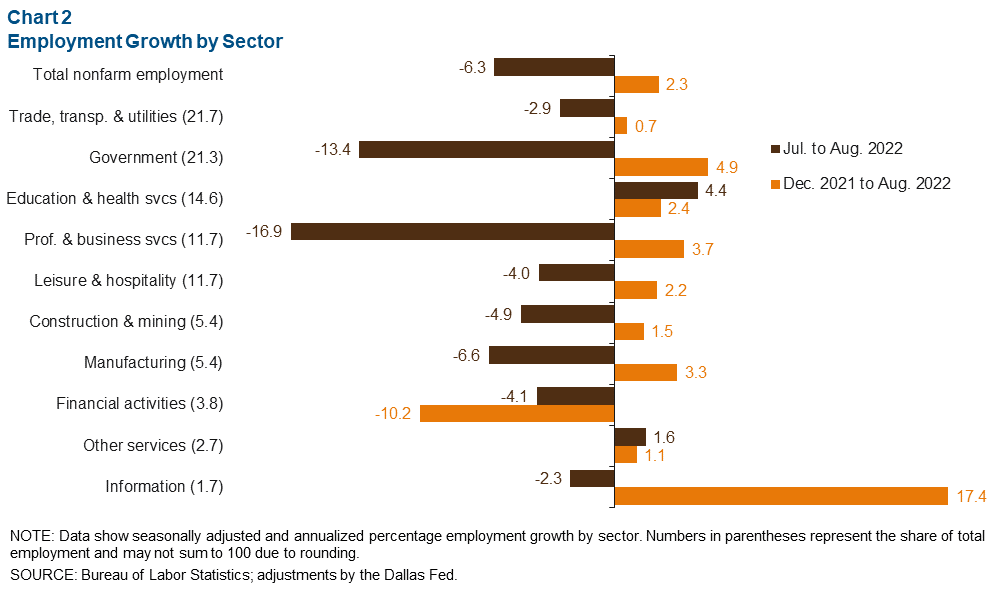
Despite significant job losses in August, year-to-date employment is up 2.3 percent (4,989 jobs). Employment has grown this year in every sector except financial activities, in which employment fell 10.2 percent (-941 jobs). Employment remains above prepandemic levels.
Unemployment continues downward trend
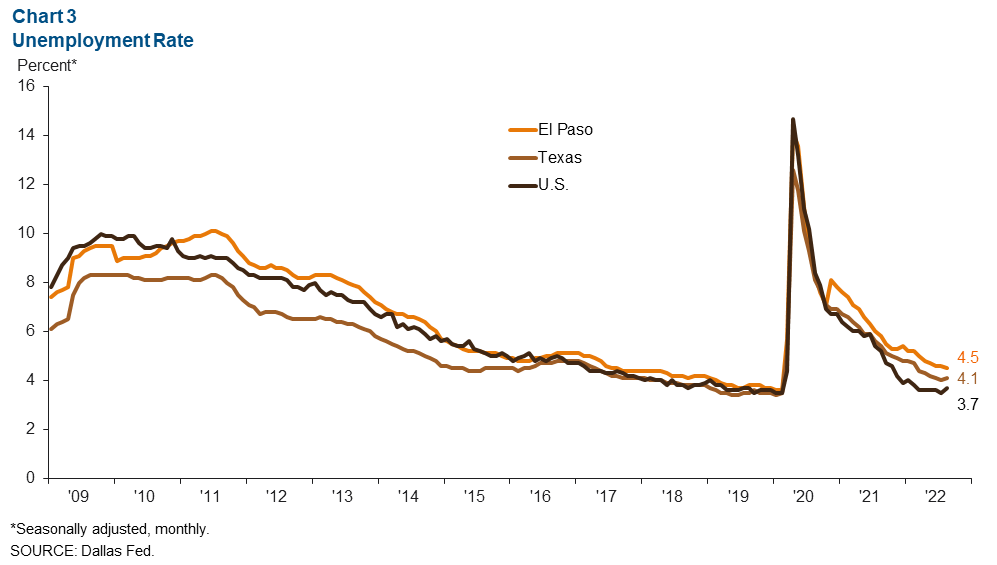
El Paso’s unemployment rate continued to decline, dropping from 4.6 percent in July to 4.5 percent in August (Chart 3). The metro area’s unemployment rate has not returned to prepandemic levels and remains above the rates in Texas (4.1) and the U.S. (3.7).
Border traffic
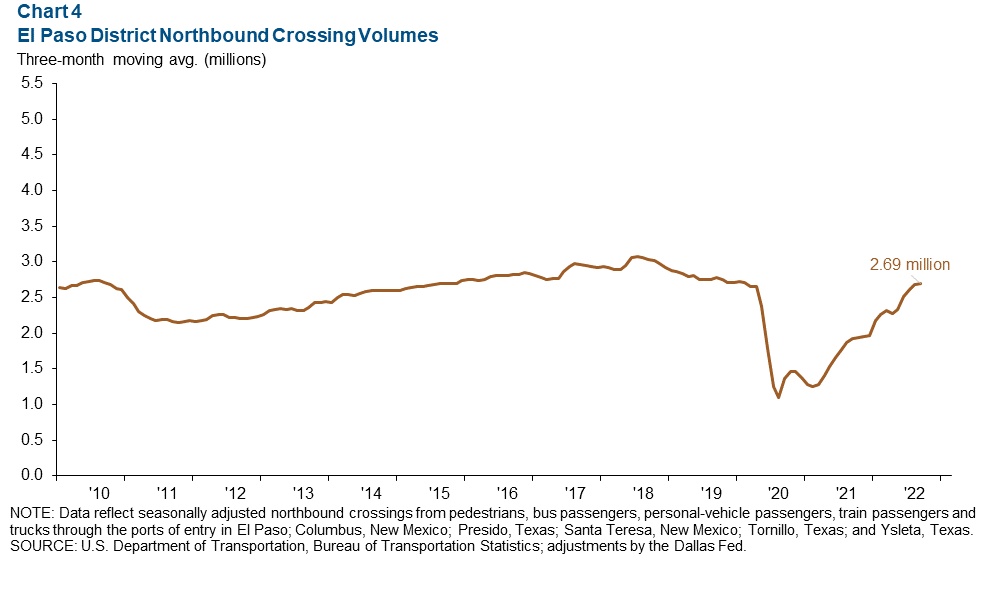
Northbound cross-border traffic through the El Paso district continues to climb and is finally above prepandemic levels. The rise in traffic signals a rebound in tourism activity by Mexican nationals since the opening of the U.S.–Mexico border in November 2021. The three-month moving average reached 2.69 million crossings in July, 0.5 percent above the previous month and 40 percent over the previous year (Chart 4). The El Paso district is defined as ports of entry in El Paso; Columbus, New Mexico; Presidio, Texas; Santa Teresa, New Mexico; Tornillo, Texas; and Ysleta, Texas.
Industrial production and maquiladora-related activities
The monthly U.S. Industrial Production (IP) Index fell 0.2 percent in August but was still 3.7 percent higher than one year ago (Chart 5). Mexico’s IP index rose 0.4 in July and is up 3.5 percent from last year. The Institute for Supply Management (ISM) manufacturing index remained unchanged at 52.8 in August, down 6.9 percent from a year ago. ISM figures above 50 signal growth.
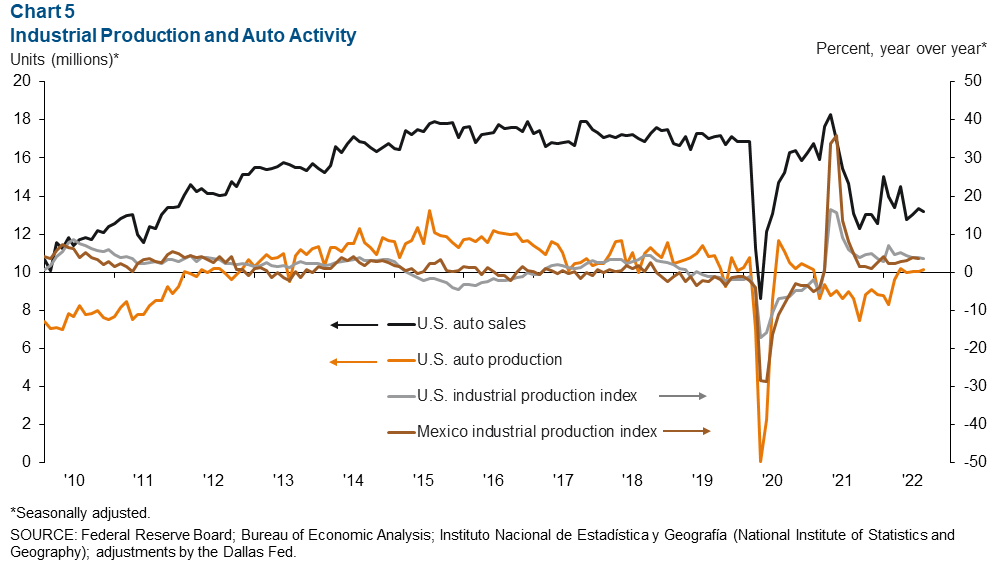
Auto sales (13.2 million units) and production (10. 2 million units) were little changed in August from the prior month. Year-over-year growth was 0.7 percent for sales and 17.7 percent for production. Industrial and auto activity are closely linked to the El Paso-area economy because of cross-border manufacturing relationships. Roughly half of maquiladoras in Juárez are auto related.
NOTE: Data may not match previously published numbers due to revisions. The El Paso metropolitan statistical area includes El Paso and Hudspeth counties.
About El Paso Economic Indicators
Questions can be addressed to Aparna Jayashankar at Aparna.Jayashankar@dal.frb.org. El Paso Economic Indicators is published every month after state and metro employment data are released.