El Paso Economic Indicators

May 26, 2023
| El Paso economy dashboard (April 2023) | |||
| Job growth (annualized) Jan.–April '23 |
Unemployment rate |
Avg. hourly earnings |
Avg. hourly earnings growth y/y |
| 0.8% | 4.3% | $23.31 | 8.3% |
El Paso’s economy experienced strong growth in April. Payrolls expanded across most sectors, the business-cycle index edged up, and unemployment fell. The subprime credit population fell in the first quarter. Both auto production and sales increased from March to April, and the manufacturing index rose.
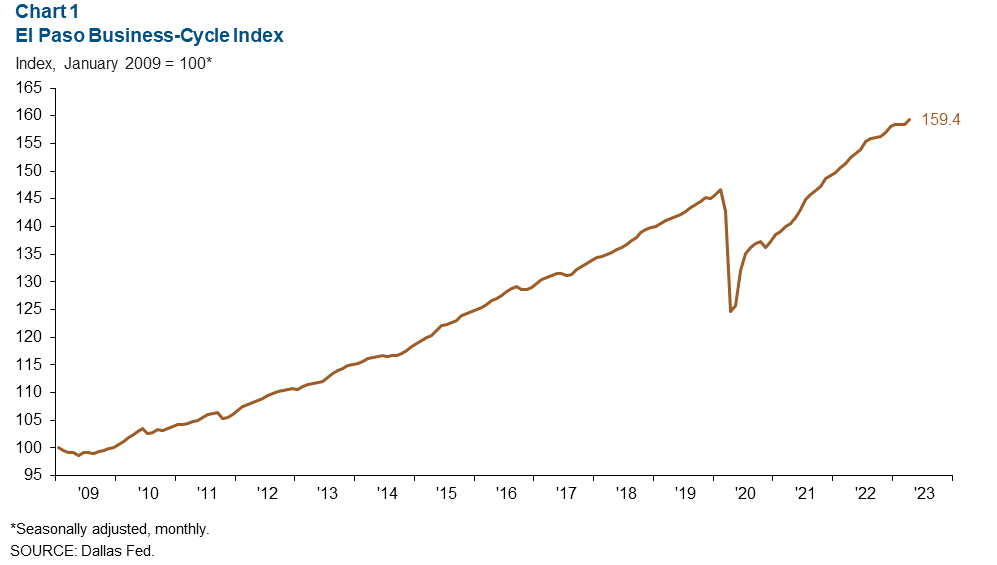
Business-cycle index
The El Paso Business-Cycle Index continued to tick up, increasing from 158.5 in March to 159.4 in April (Chart 1). The index was up 4.6 percent from April 2022.
Labor market
Employment growth broad based across sectors
Employment grew an annualized 4.3 percent in April (1,184 jobs) (Chart 2). Payrolls grew in all sectors but financial activities (22). Education and health services (292), leisure and hospitality (207), professional and business services (180), and construction and mining (161) experienced the most growth.
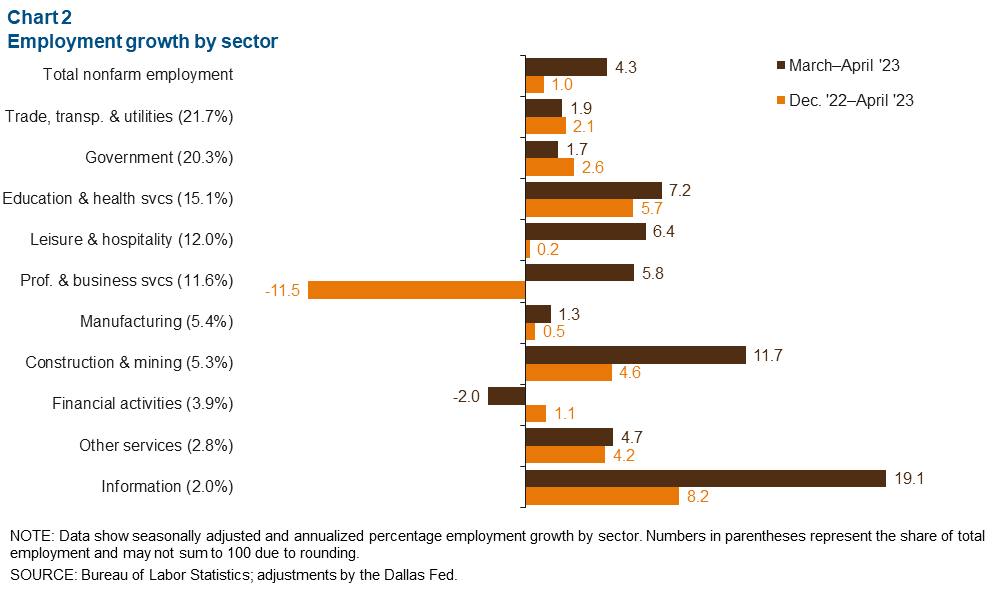
Total nonfarm employment has increased 1.0 percent year to date (1,069). Growth was dampened by professional and business services, the only sector to lose jobs (1,610). Education and health services (924), government (575) and trade, transportation and utilities (511) added the most jobs on net.
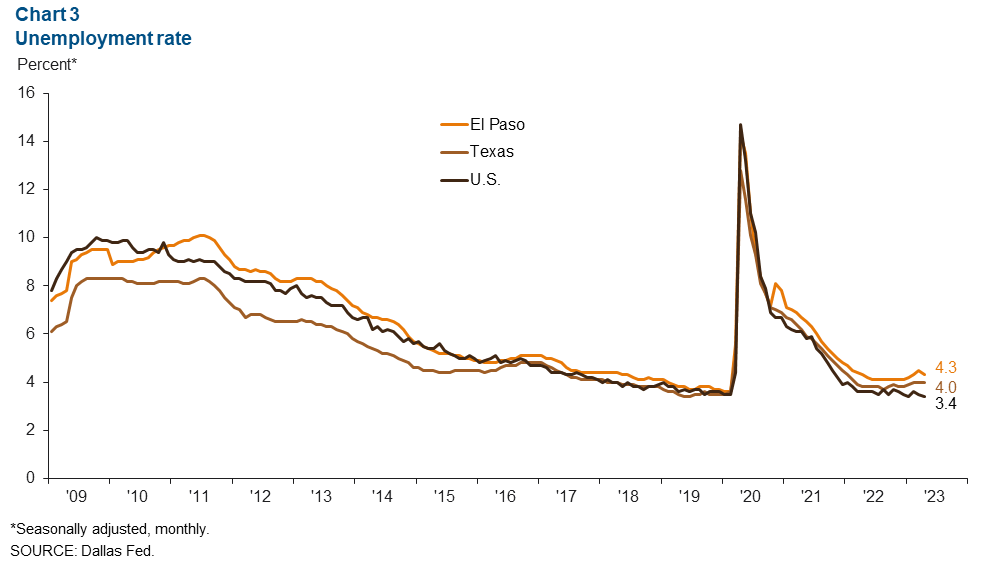
Unemployment rate softens
El Paso’s unemployment rate fell from 4.5 percent in March to 4.3 percent in April (Chart 3). It was unchanged from last April and remained above the rates for Texas (4.0 percent) and the U.S. (3.4 percent).
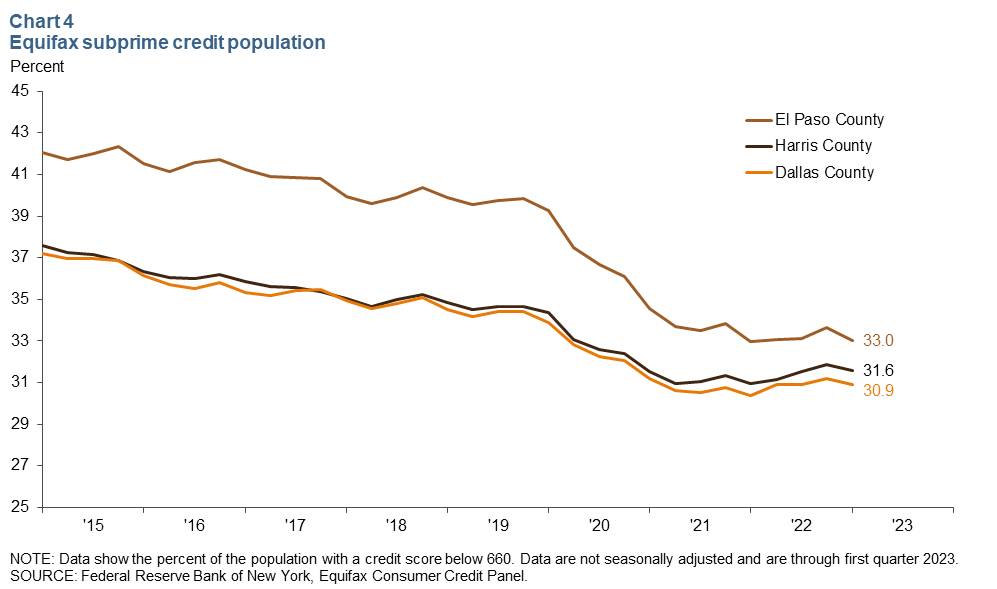
Subprime credit population
El Paso County’s subprime credit population declined to 33.0 percent in first quarter 2023 (Chart 4). This share is unchanged from the first quarter last year but is down from prepandemic levels; 39.9 percent of the population had subprime credit in first quarter 2019. The subprime credit populations are smaller in Dallas County (30.9 percent) and Harris County (31.6 percent).
Industrial production and maquiladora-related activities
The monthly U.S. industrial production (IP) index grew 0.5 percent in April and was up 0.2 percent from April 2022 (Chart 5). Meanwhile, the Mexico IP index fell 0.9 percent in March but was up 1.5 percent from March 2022. The Institute for Supply Management (ISM) manufacturing index rose 0.8 percentage points to 47.1. ISM indexes below 50 signal contraction in the manufacturing sector.
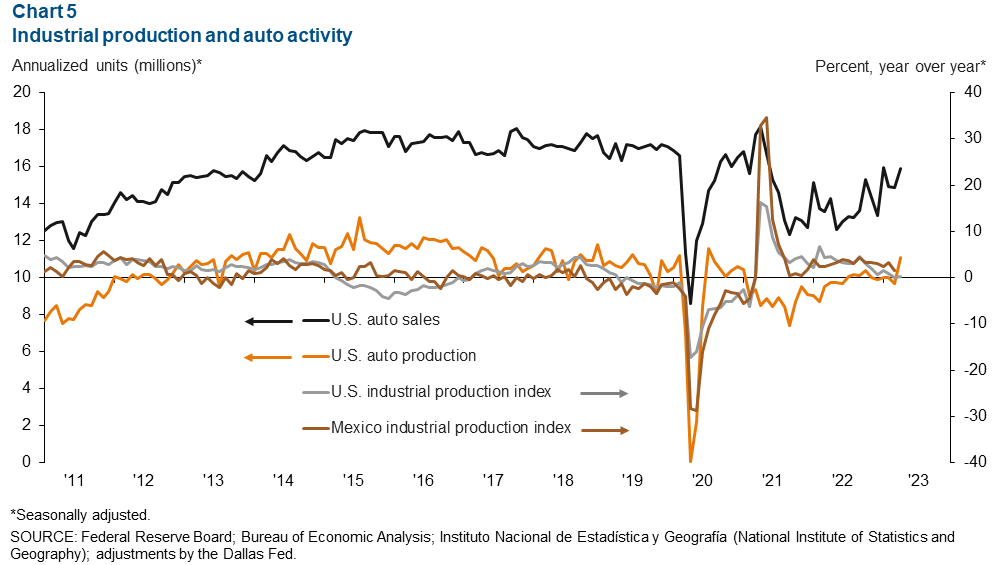
In April, U.S. monthly auto production rose by an annualized 1.4 million units, and sales increased by an annualized 1.1 million units. Production and sales were up 13.8 percent and 11.4 percent, respectively, from last year. Industrial and auto activity are closely linked to the El Paso-area economy because of cross-border manufacturing relationships. Roughly half of maquiladoras in Juárez are auto related.
NOTE: Data may not match previously published numbers due to revisions. The El Paso metropolitan statistical area includes El Paso and Hudspeth counties.
About El Paso Economic Indicators
Questions or suggestions can be addressed to Aparna Jayashankar at Aparna.Jayashankar@dal.frb.org. El Paso Economic Indicators is published every month after state and metro employment data are released.