El Paso Economic Indicators

July 26, 2023
| El Paso economy dashboard (June 2023) | |||
| Job growth (annualized) March–June '23 |
Unemployment rate |
Avg. hourly earnings |
Avg. hourly earnings growth y/y |
| 2.8% | 4.0% | $22.50 | 3.4% |
El Paso’s employment growth was mixed across sectors in June, but overall growth was flat. The business-cycle index increased, and the unemployment rate dropped. Average hourly wage growth slowed after a period of rapid growth in 2022 and early 2023. The U.S. industrial production index declined from last year. Auto production fell, while auto sales edged up.
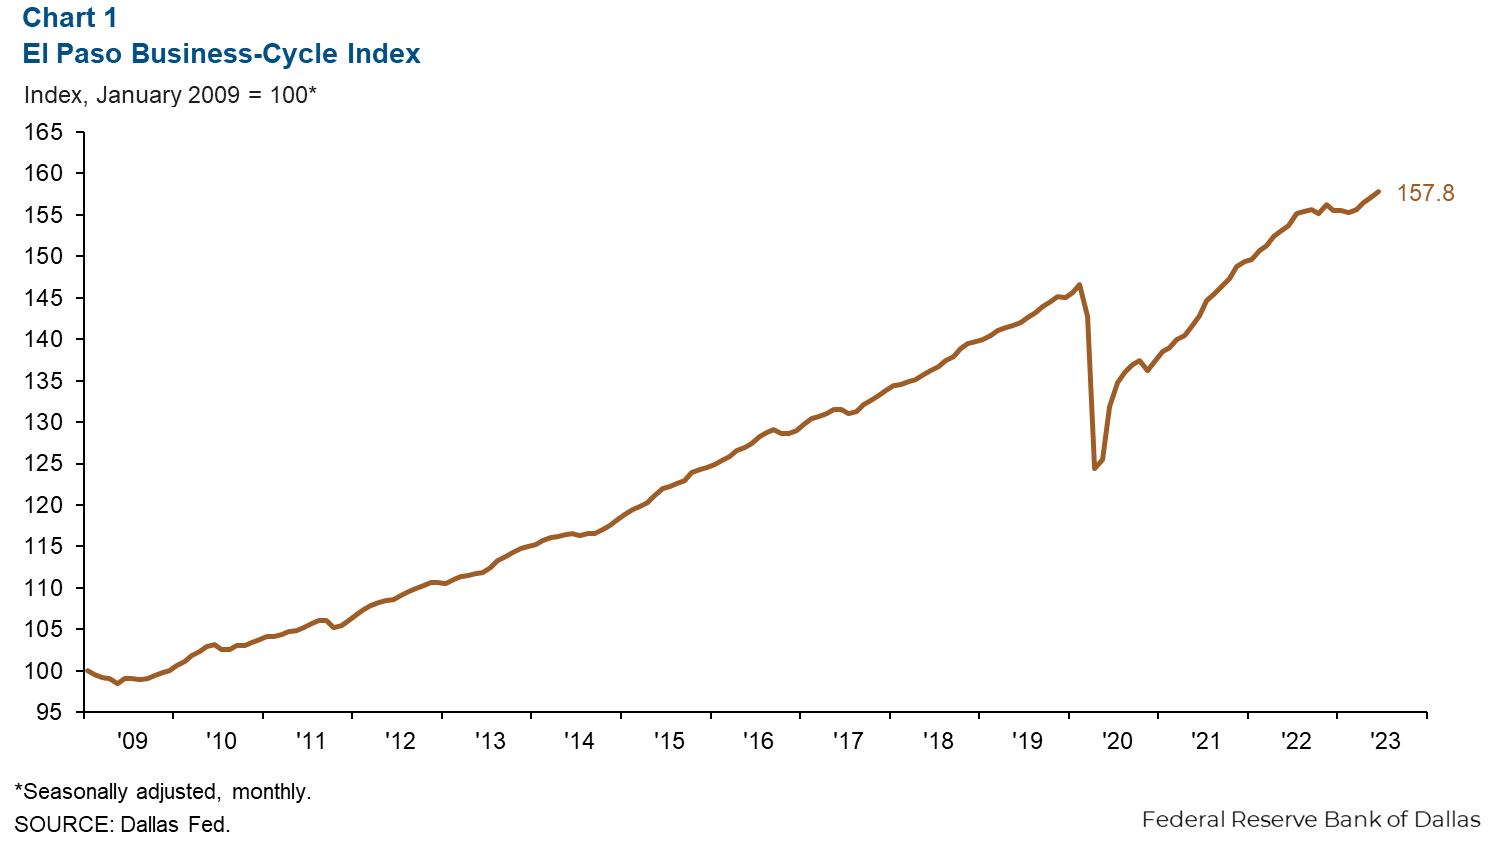
Business-cycle index
The El Paso Business-Cycle Index increased from 157.1 in May to 157.8 in June, continuing its upward trend (Chart 1).
Labor market
Payroll growth mixed across sectors
Payrolls grew an annualized 0.3 percent in June (76 jobs) (Chart 2). Growth was mixed, as some sectors experienced strong growth, and others saw large declines. Sectors adding the most jobs were government (370 jobs), construction and mining (175), and trade, transportation and utilities (174). Professional and business services (558) and leisure and hospitality (301) lost jobs.
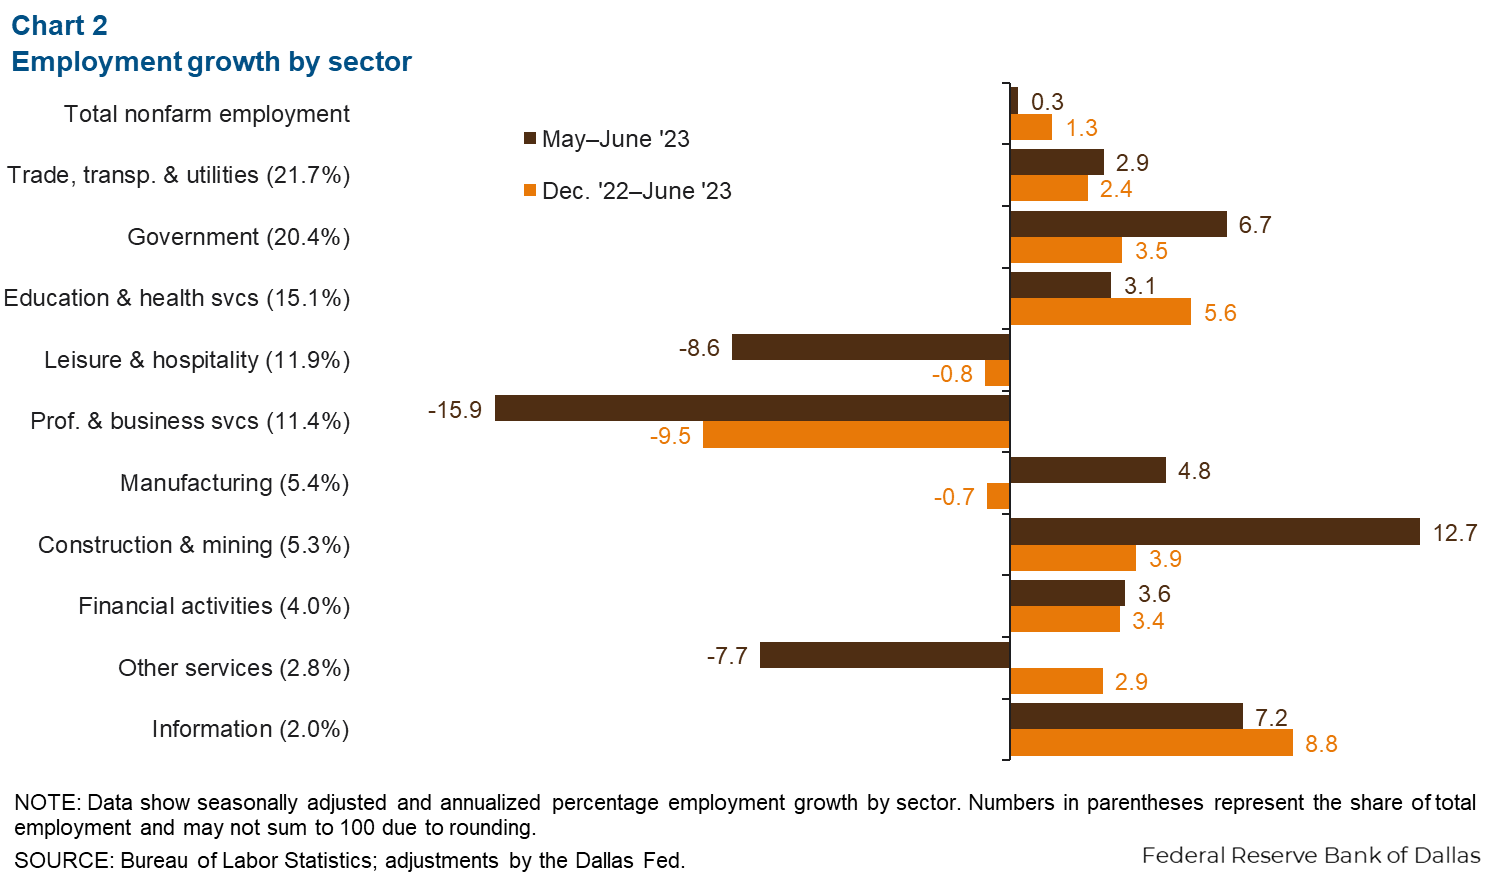
El Paso payrolls grew 1.3 percent in the first half of 2023 (2,192 jobs). Employment growth was positive in all sectors except professional and business services (1,959), leisure and hospitality (152), and manufacturing (65). Gains were seen in education and health services (1,372), government (1,164), and trade, transportation and utilities (864).
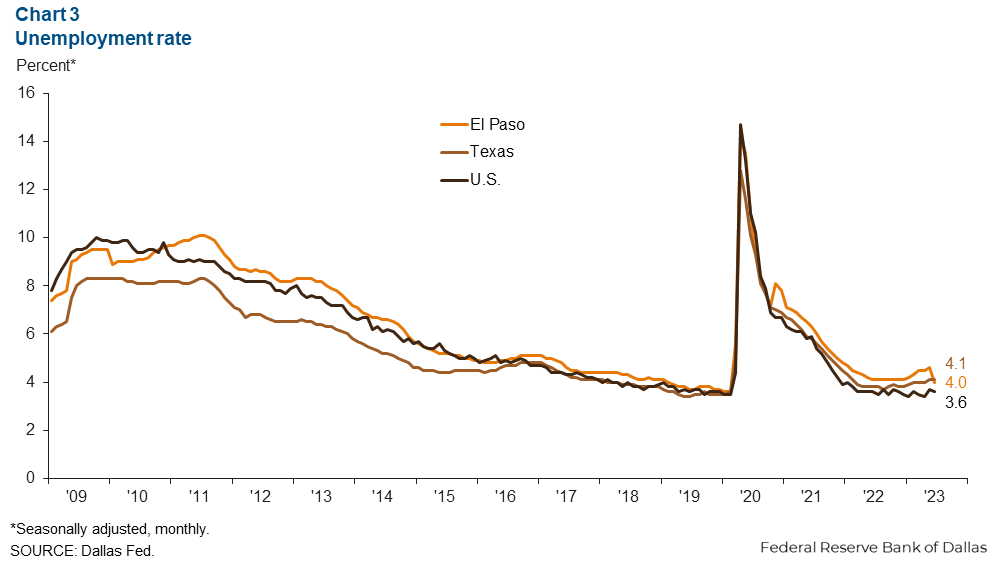
Unemployment rate falls
El Paso’s unemployment rate fell from 4.6 percent in May to 4.0 percent in June as the labor force grew, unemployment decreased, and more people became employed (Chart 3). In comparison, the unemployment rate changed little in Texas (4.1) and the U.S. (3.6).
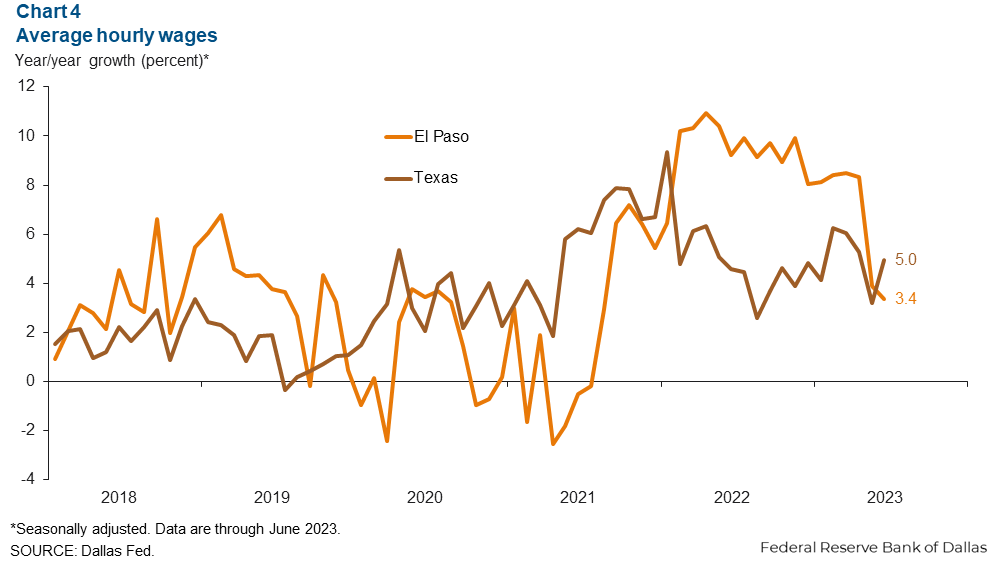
Average hourly wages
El Paso’s average hourly wages were $22.50 in June, a 3.4 percent increase from June 2022 (Chart 4). In May, year-over-year growth fell below 8.0 percent for the first time since January 2022. Meanwhile, Texas’ average hourly wages were $31.32 in June, a 5.0 percent increase from June 2022.
Industrial production and maquiladora-related activities
In June, the monthly U.S. industrial production (IP) index declined year-over-year from last June for the first time since February 2021, decreasing 0.4 percent (Chart 5). The index fell 0.5 percent from May to June 2023. The Institute for Supply Management (ISM) index dropped 0.9 percentage points in June to 46, down 7.1 points from June last year. ISM indexes below 50 signal contraction in the manufacturing sector. Meanwhile, the Mexico IP index increased 1.0 percent from April to May and was up 2.8 percent from May last year.
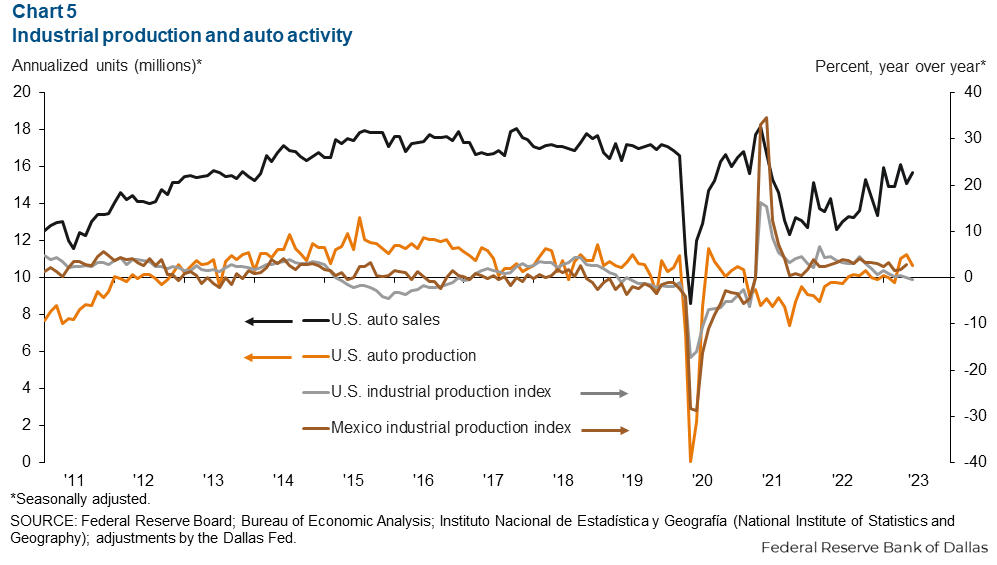
U.S. monthly auto production softened in June, declining by an annualized 600,500 units. However, sales increased by an annualized 602,000 units. Production and sales were up 10.2 percent and 20.2 percent, respectively, from last year. Industrial and auto activity are closely linked to the El Paso-area economy because of cross-border manufacturing relationships. Roughly half of maquiladoras in Juárez are auto related.
NOTE: Data may not match previously published numbers due to revisions. The El Paso metropolitan statistical area includes El Paso and Hudspeth counties.
About El Paso Economic Indicators
Questions or suggestions can be addressed to Aparna Jayashankar at Aparna.Jayashankar@dal.frb.org. El Paso Economic Indicators is published every month after state and metro employment data are released.