El Paso Economic Indicators

| El Paso economy dashboard (June 2025) | |||
| Job growth (annualized) Mar.–Jun. '25 |
Unemployment rate |
Avg. hourly earnings |
Avg. hourly earnings growth y/y |
| 0.4% | 4.1% | $24.41 | 7.9% |
Employment growth in El Paso slowed over the past three months. The unemployment rate declined in June. Existing-home sales ticked down, while months of inventory increased further. Trade volumes continued to trend upward.
Labor market
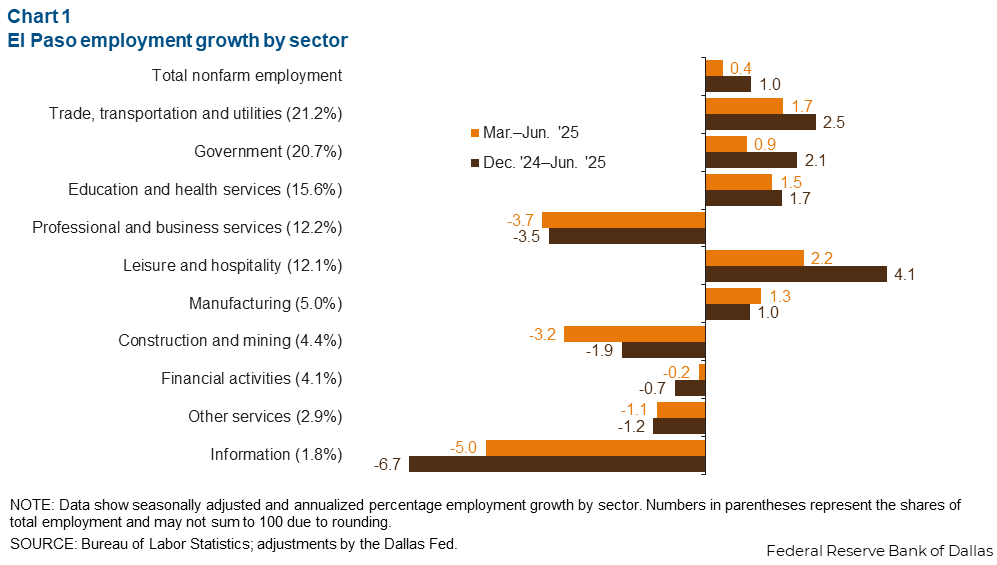
Employment growth slows
Employment growth in El Paso contracted for the second straight month in June. As a result, employment only increased an annualized 0.4 percent (340 jobs) in the second quarter (Chart 1). Trade, transportation and utilities experienced the largest gains (330 jobs), followed by leisure and hospitality (240 jobs). However, several sectors shed jobs. The most notable declines were in professional and business services (-410 jobs) and construction and mining (-130 jobs). Year to date, payroll employment in El Paso has grown an annualized 1.0 percent.
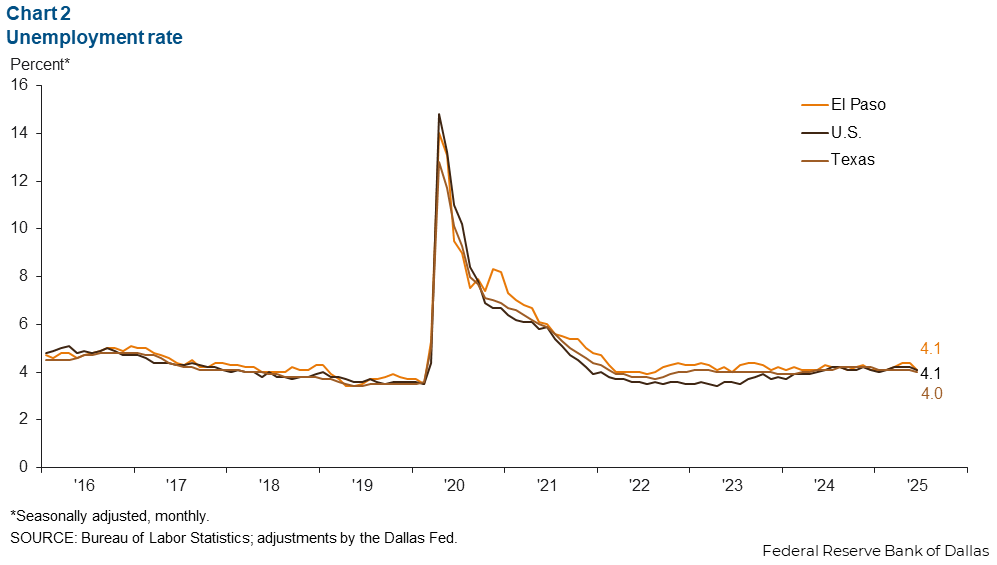
Unemployment rate declines
El Paso’s unemployment rate ticked down in June to 4.1 percent from 4.4 percent in May (Chart 2). El Paso’s jobless rate in June was in line with that of the nation but remained slightly above the state unemployment rate (4.0 percent).
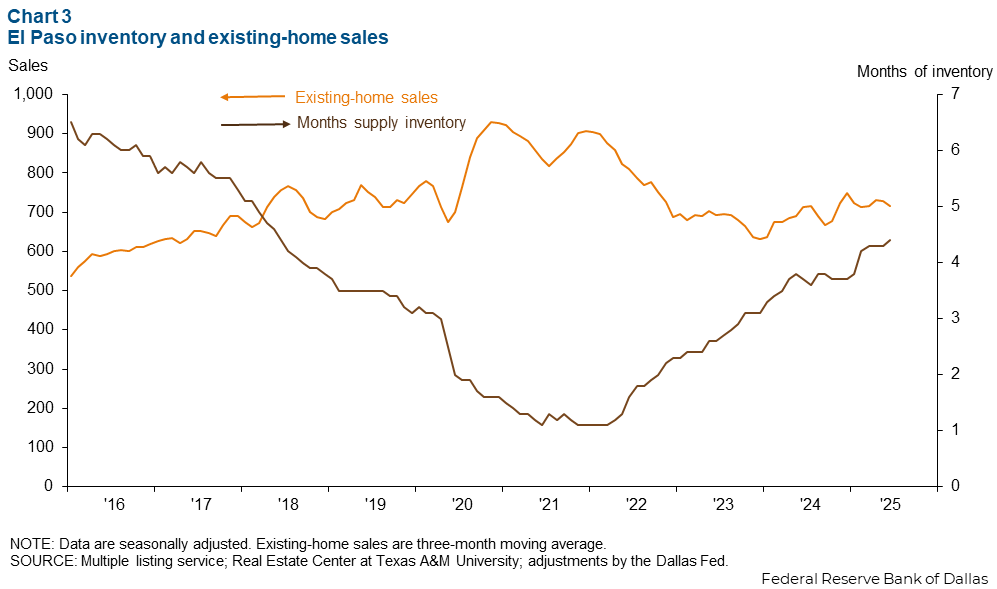
Housing
The three-month moving average of existing-home sales ticked down in El Paso in June (Chart 3). Home sales were down 3.1 percent in June compared with year-ago levels, while prices were flat. Meanwhile, months of inventory continued to trend higher in El Paso, reaching 4.4 months in June.
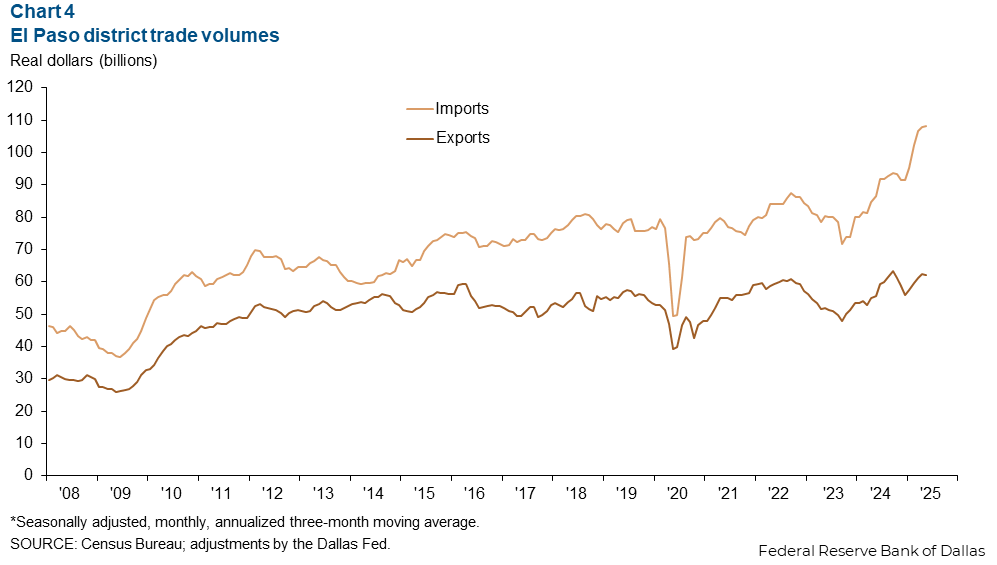
Trade
El Paso’s economy is highly dependent on international trade. The three-month moving average of imports through El Paso ticked up slightly to an annualized $108.1 billion in May from $107.8 in April (Chart 4). Meanwhile, exports declined slightly to an annualized $62.1 billion from $62.3 billion in April. Total trade volumes have continued to trend higher this year, increasing 15.6 percent from the end of last year.
NOTE: Data may not match previously published numbers due to revisions. The El Paso metropolitan statistical area includes El Paso and Hudspeth counties.
About El Paso Economic Indicators
Questions or suggestions can be addressed to Isabel Brizuela at isabel.brizuela@dal.frb.org. El Paso Economic Indicators is published every month after state and metro employment data are released.