Houston Economic Indicators

The professional services sector continues to lead a broad-based acceleration in the Houston economy this year amid strong growth in the local labor force. Construction employment is surging as the existing-home market remains tight. Healthy growth in the Houston Leading Index and robust growth in the Houston Business-Cycle Index suggest a continued positive outlook.
Business-Cycle and Leading Indexes
The Houston Business-Cycle Index grew a roaring 8.9 percent from March to June (Chart 1). The index has been rising at an accelerated rate since November 2017 due to the effects of an expanding energy industry, a post-Hurricane Harvey boost and broader global economic strength.
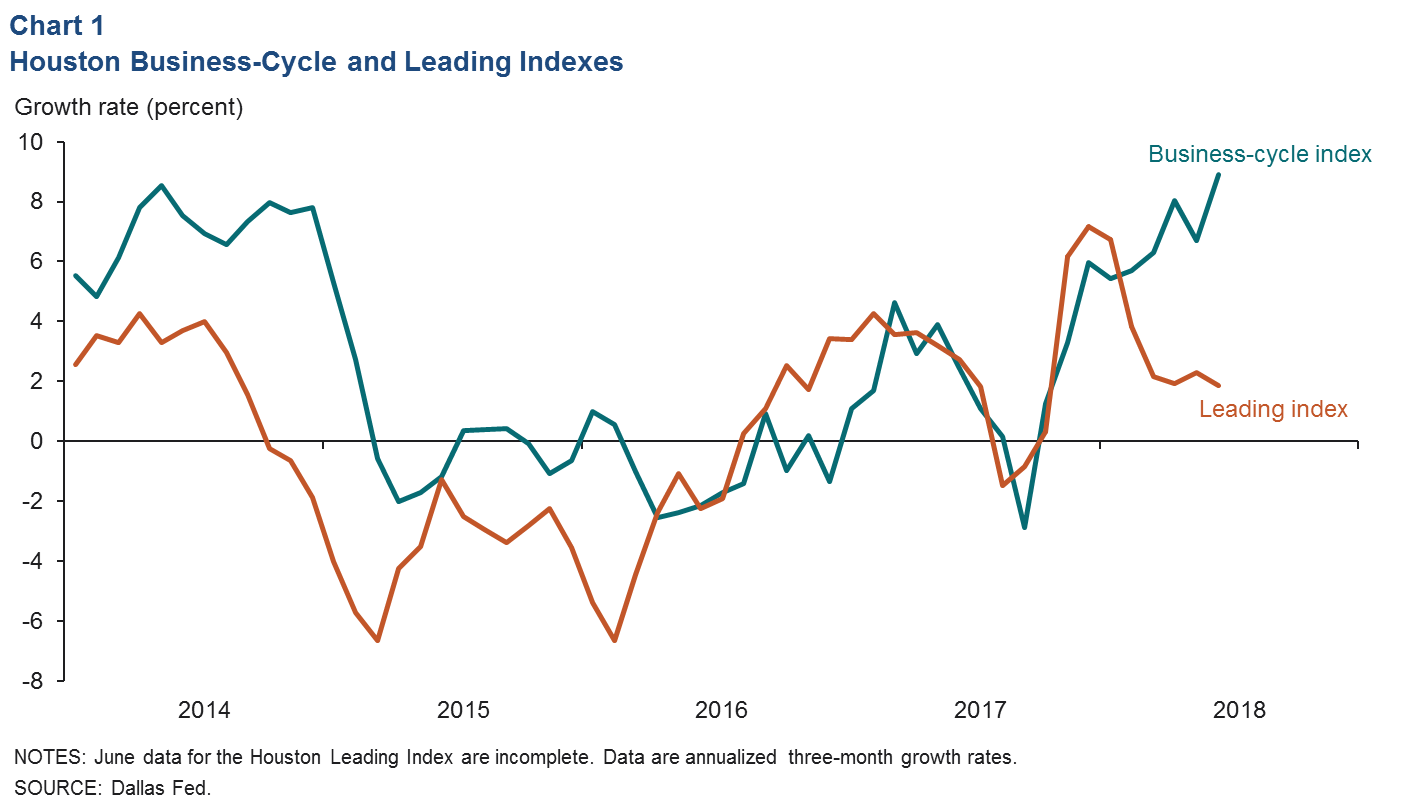
An index of 11 leading indicators for Houston slowed to a growth rate of 1.9 percent for the three months ending in June. While a far cry from the 7.2 percent in December 2017, recent growth in the index is supportive of healthy, but somewhat weaker, job gains ahead.
Employment
Houston job growth accelerated to 5.5 percent (about 41,600 jobs) from March to June. If the numbers stand up to revisions later this year, that would make March to June the fastest three months of job growth since February 1998.
The biggest gains the past three months were in professional and business services (11,500), followed by construction (6,800) and manufacturing (4,000). The only sector to decline over that period was other services (such as mechanics, laundromats and pet hotels), which lost 700 jobs (Chart 2).
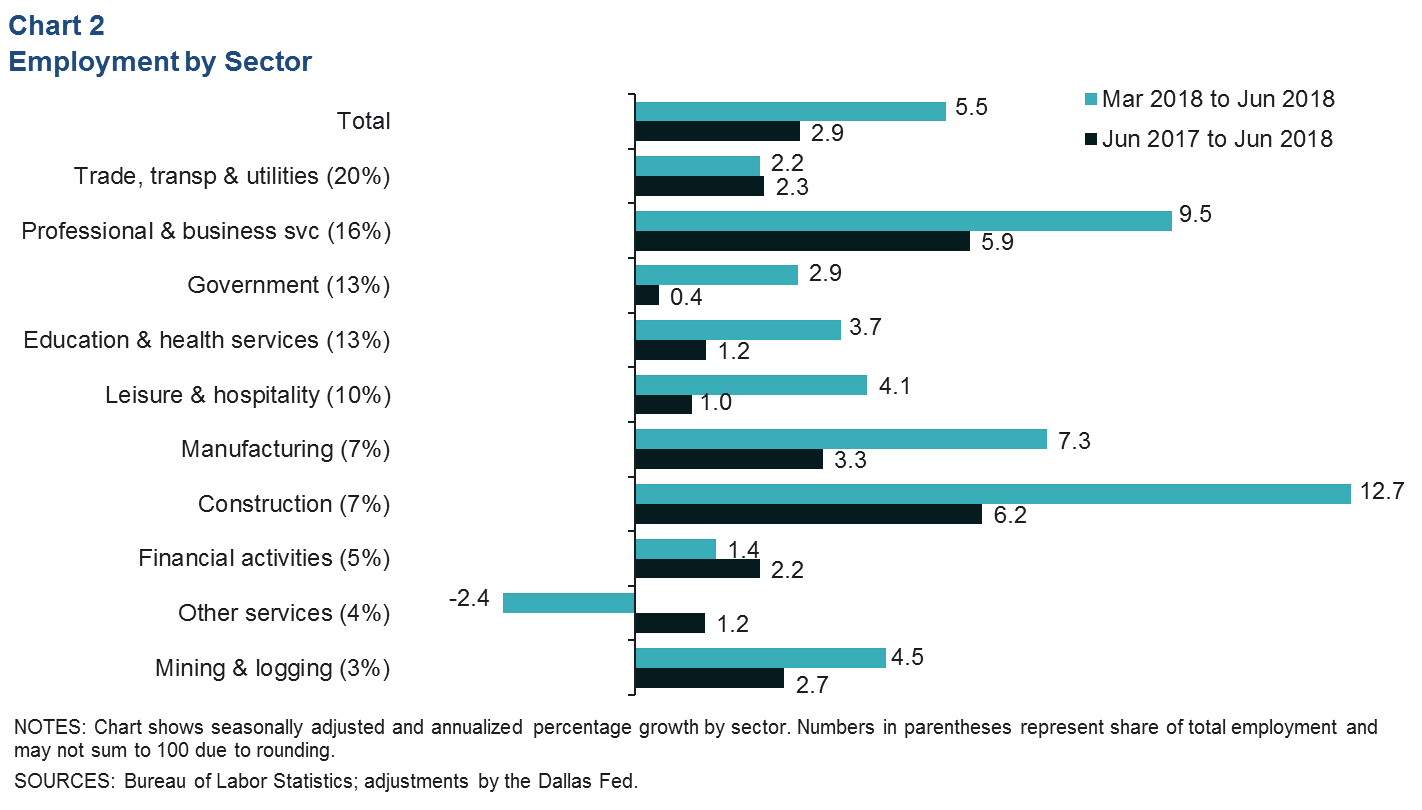
Year-over-year job growth was 2.9 percent in June (88,500). Professional and business services (28,600) and construction (13,300) were the fastest-growing sectors, though trade, transportation and utilities (14,200) added more jobs than construction did.
The unemployment rate in Houston was 4.4 percent in June—down from the December 2017 rate of 4.6 percent. The decline over that six-month period is notable for the rapid increase in the size of the labor force, which grew 3.4 percent, compared with 1 percent in the first half of 2017. For comparison, Houston’s labor force growth in the first half of this year outpaced gains at the height of the fracking boom.
Construction and Real Estate
Construction Jobs Pick Up Pace Again
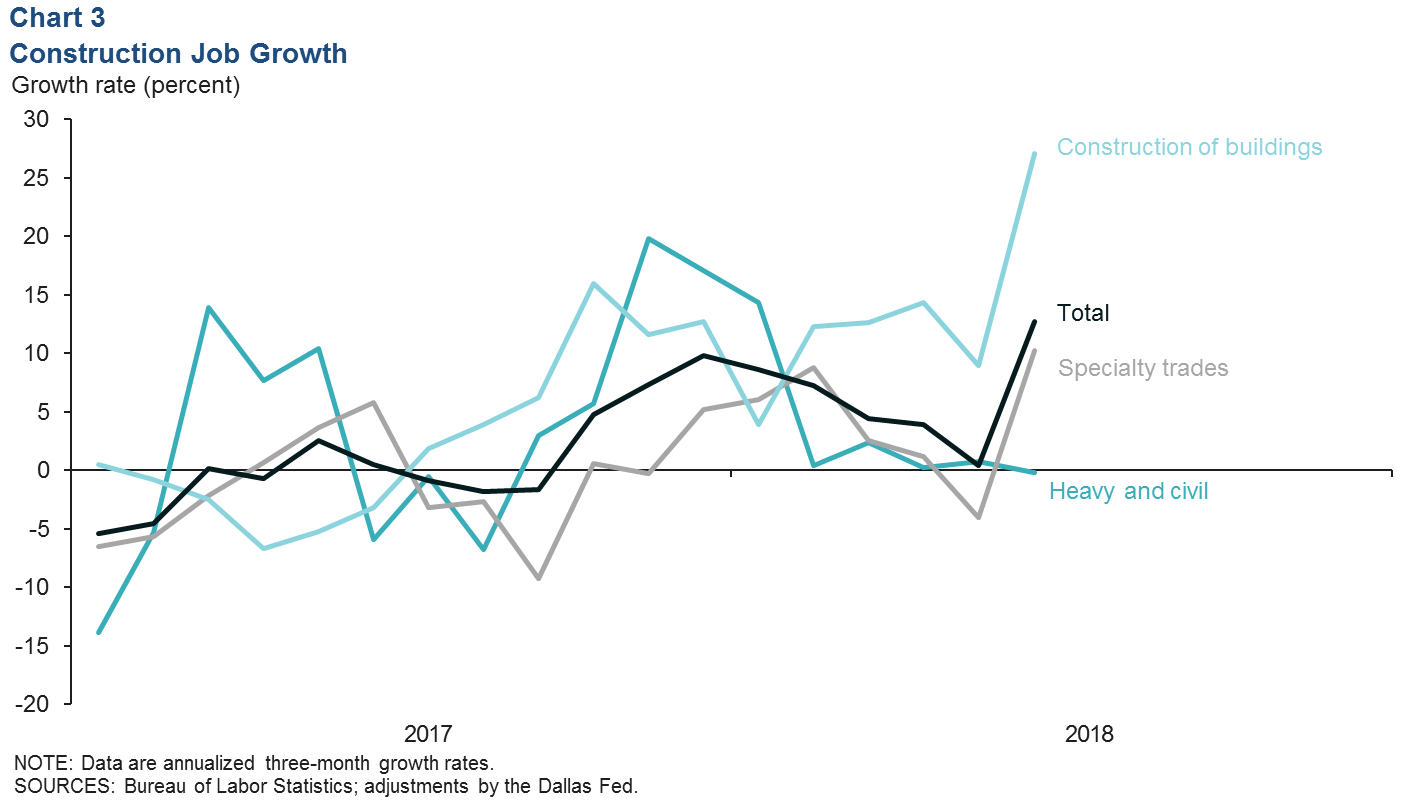
Construction job growth surged last year after Hurricane Harvey as flooded homes were remodeled, repaired and rebuilt. The growth rate rose to an annualized pace of 9.8 percent between September and December. Growth slowed to 0.4 percent in the months that followed as heavy and civil construction and specialty trades jobs declined.
However, construction jobs grew 12.7 percent from March to June 2018. Construction of buildings (3,700 jobs)—the only construction sector that didn’t appreciably slow down this year—led industry growth. The larger specialty trade contractor category that includes plumbers and electricians (2,800) also grew well in excess of historical norms (Chart 3).
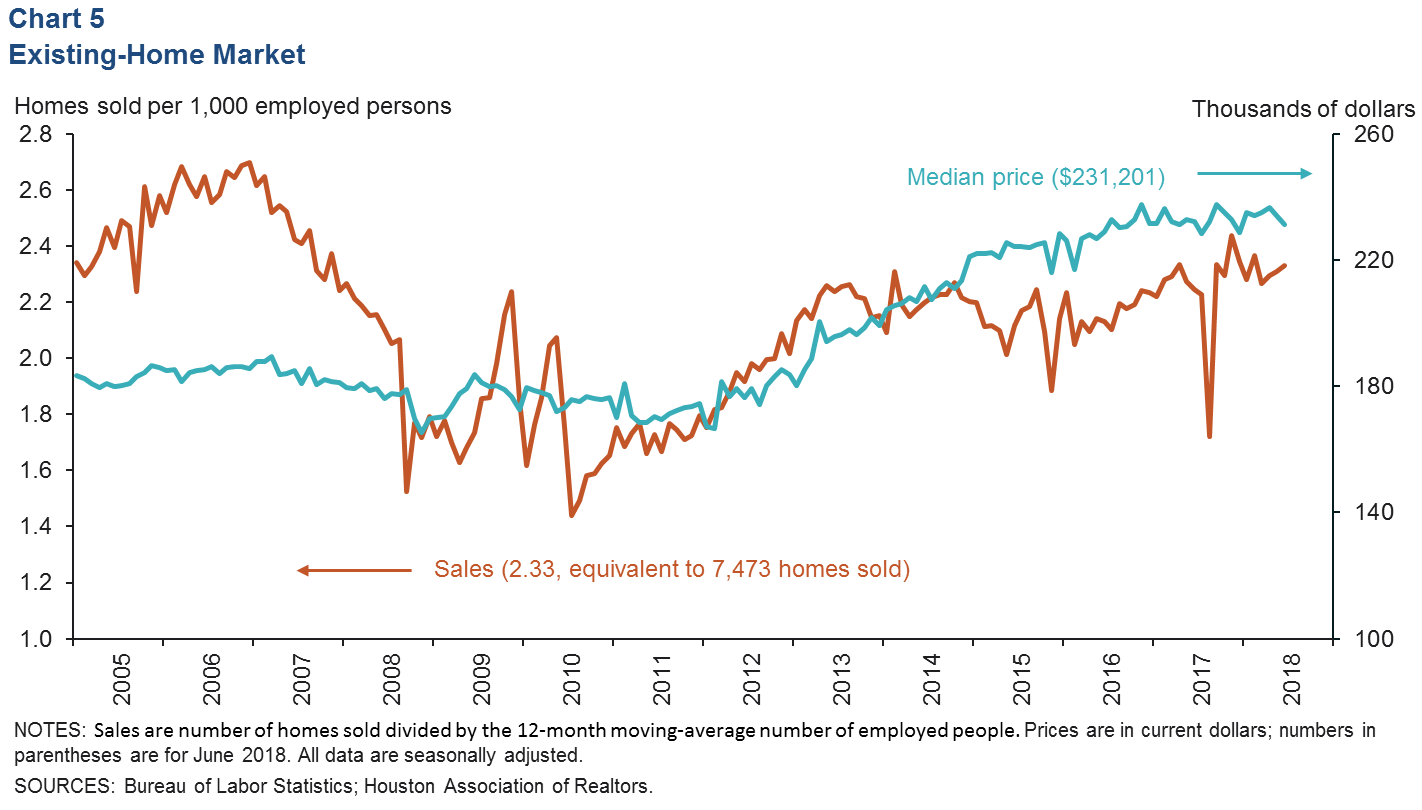
Existing-Home Market Remains Tight
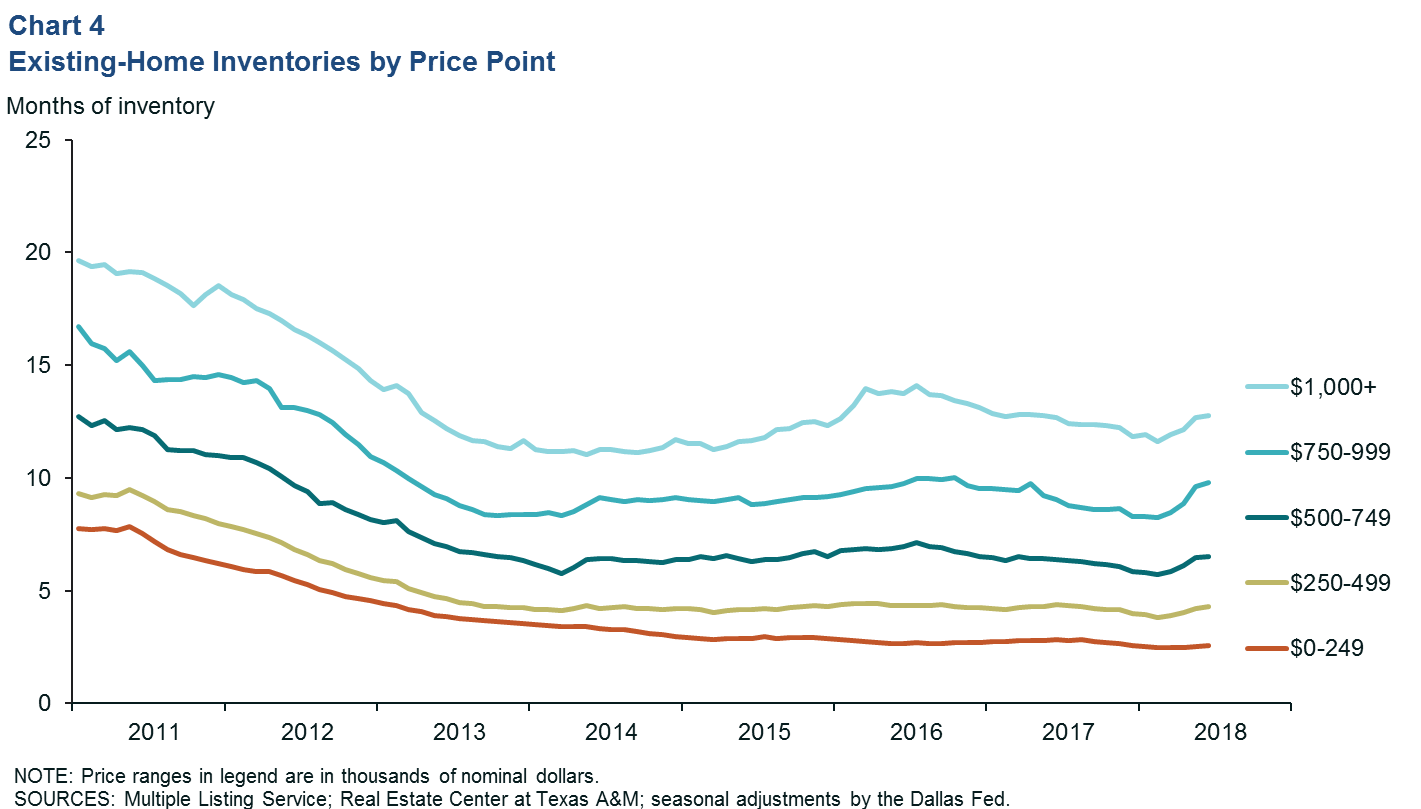
The balance between a buyer’s market (many more sellers than buyers) and a seller’s market (many more buyers than sellers) is likely between four and five months of supply. The Houston housing market remains a seller’s market at a tight 3.8 months’ supply. Homes priced below $250,000 have a mere 2.6 months of inventory, while homes in higher-priced segments have 4.3 months of supply and above (Chart 4).
The median price of a home sold slipped to $231,201 in June. Home sales increased to 7,473 on a seasonally adjusted basis—the third-highest sales number on record and the third consecutive month of growth. That’s about 2.3 homes sold for every 1,000 employed persons in the metro, which is in the middle of the post-Harvey range but still well below sales rates observed at the height of the housing boom in 2006 (Chart 5).
Seasonally adjusted permits for single-family home construction fell for the third consecutive month to 3,316 in May (three-month moving average), below year-ago levels of 3,363. Multifamily construction permits, however, surged to levels not seen since the oil bust took hold of Houston in early 2015.
Apartment Vacancies Begin to Rise
Apartment vacancy rates declined sharply toward the end of 2017 to 5.9 percent as flooding forced many people out of their homes temporarily. First-quarter data saw a modest increase to 6.3 percent, and industry projections are for second-quarter vacancies to rise further as people return to their homes (Chart 6).
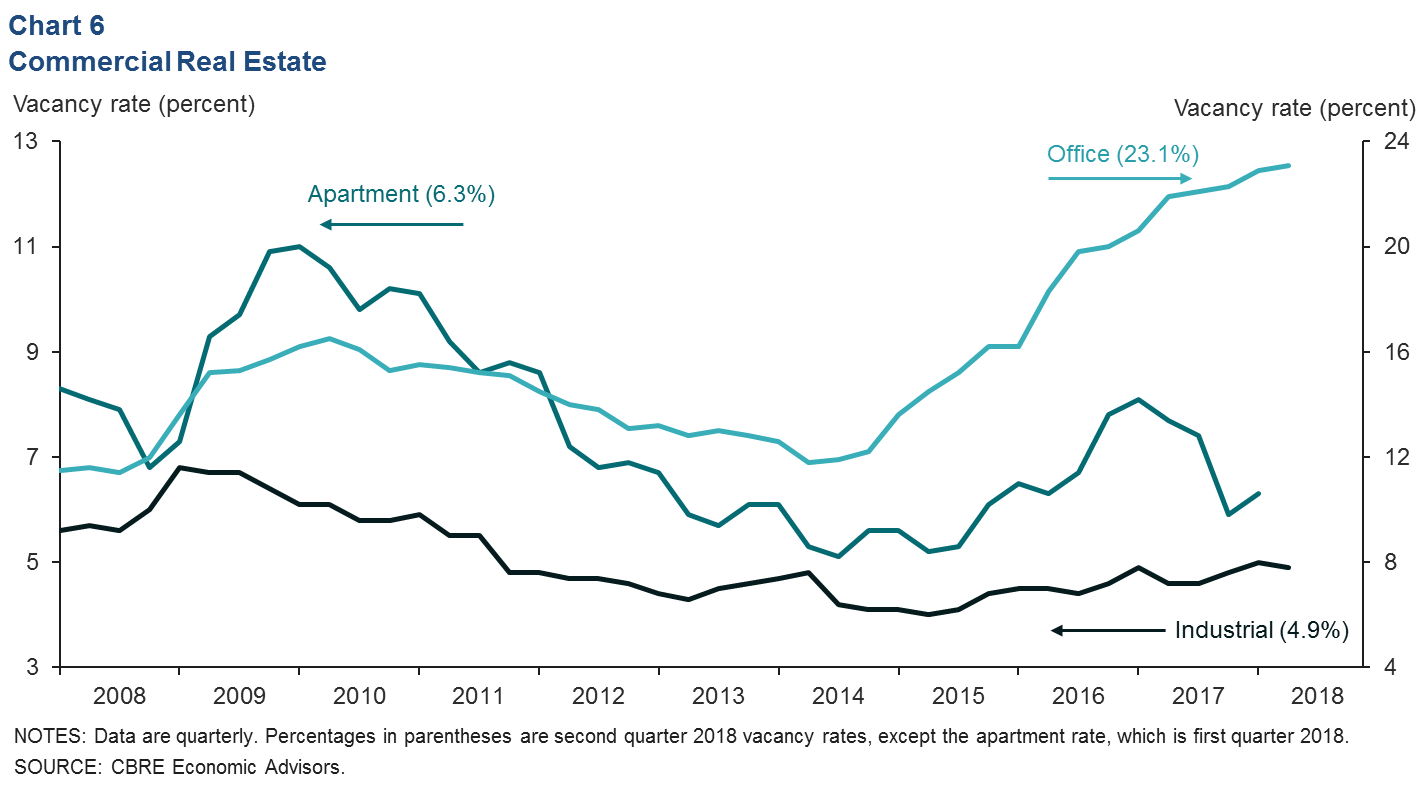
The vacancy rate for commercial office space remained elevated at 23.1 percent in the second quarter despite strong growth in professional and business services jobs, which has historically been associated with increased absorption of vacant office space. The vacancy rate in the industrial market was also little changed from the first quarter at a tight 4.9 percent.
NOTE: Data may not match previously published numbers due to revisions.
About Houston Economic Indicators
Questions can be addressed to Jesse Thompson at jesse.thompson@dal.frb.org. Houston Economic Indicators is posted on the second Monday after monthly Houston-area employment data are released.