Houston Economic Indicators

Softer employment growth in July slowed the business-cycle index to a more modest above-trend growth rate. Revisions to employment data dulled Houston’s stellar job growth in the six months following Hurricane Harvey, and after a still-strong first half of 2018, most leading indicators suggest some deceleration in the second half of the year. Overall, however, the outlook remains positive.
Business-Cycle and Leading Indexes
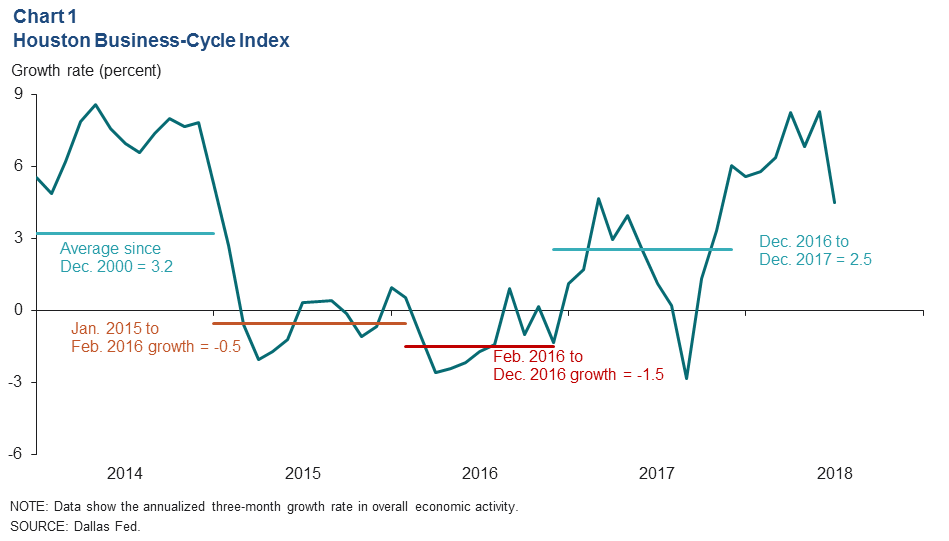
Growth in the Houston Business-Cycle Index slowed to 4.5 percent between April 2018 and July 2018 due to slower job growth (Chart 1). However, this figure remains well above the historical growth rate of 3.2 percent and in line with what occurred during the oil and gas boom of 2013 and 2014. An expanding energy sector, post-Harvey recovery and a healthier U.S. economy have all contributed to elevated growth in Houston so far this year.
Employment
Houston jobs slowed from a revised 5.2 percent growth rate (about 38,400 jobs) between March and June to 2.7 percent (20,700) between April and July (Chart 2). That slowdown was driven by an estimated net-zero job growth from June to July. Leisure and hospitality (-3,900) was the loss leader over the three months ending in July, while other services (such as laundromats, auto mechanics and animal boarding, -3,200) contracted at the fastest rate.
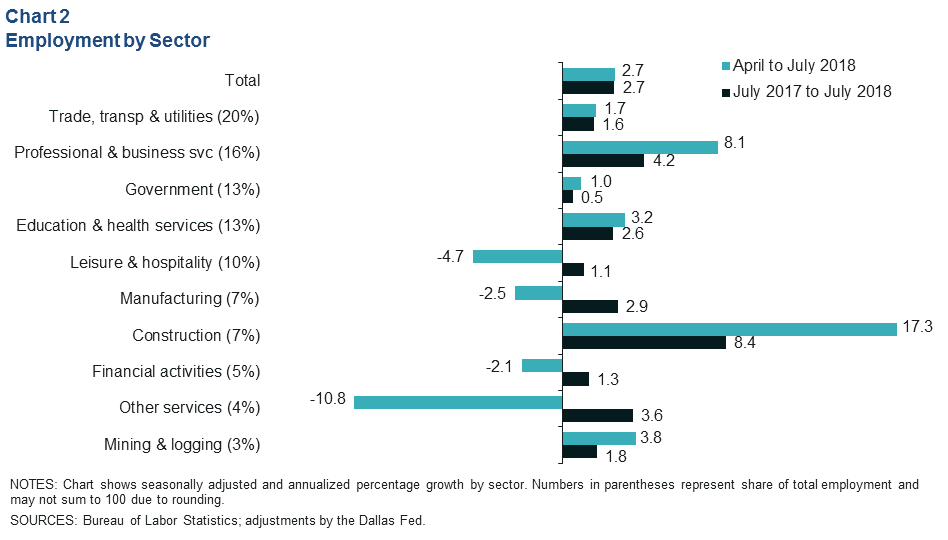
April-to-July job gains came principally from professional and business services (9,600) and construction (9,100). Job growth was broad based within both industry groups with notable rises in services to buildings and dwellings (such as janitorial and landscaping services), construction of buildings (such as framers, carpenters, construction managers or general construction labor) and architectural, engineering and related services.
Job data over the six months following Hurricane Harvey were altered substantially in the most recent early benchmarking. Job growth between September 2017 and December 2017 was revised up from 3.8 percent to 4.6 percent. Conversely, job growth from December 2017 to March 2018 was revised down considerably from 4.1 percent to 1.8 percent. On net, the revisions erased nearly 10,000 jobs from Houston payrolls.
Incorporating those revisions, year-over-year growth in Houston was 2.7 percent (80,700) in July 2018—the fastest rate since March 2015. Professional and business services (20,300) and construction (18,000) were again the fastest-growing supersectors.
Labor Force
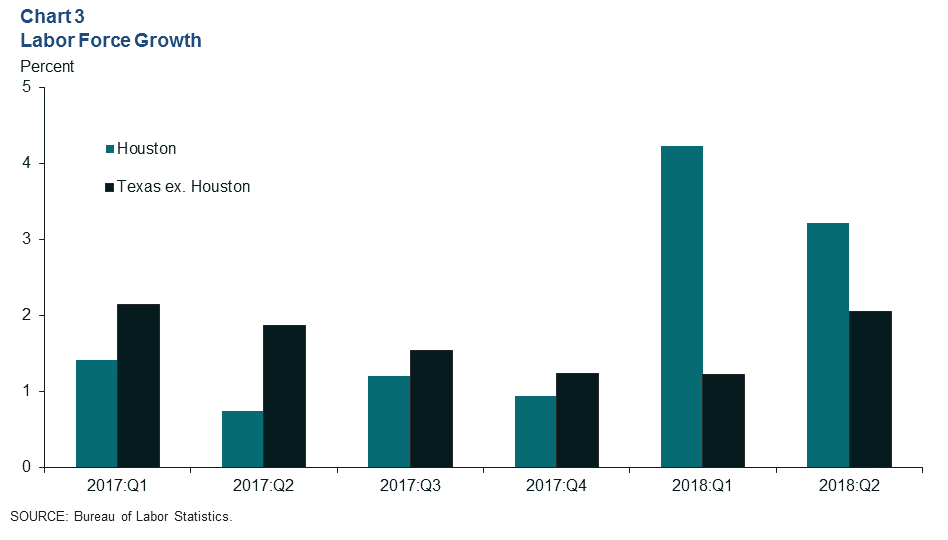
The Houston labor force (total number of employed people plus the total number of unemployed people) expanded at a strong annual pace in first quarter 2018, the fastest rate since first quarter 2010 when Houston resurged from the Great Recession. While labor force growth declined somewhat in the second quarter, it expanded faster than the rest of the state (Chart 3).
The unemployment rate in Houston edged down to 4.3 percent in July—matching the post-Great Recession low in February 2015 at the cusp of the oil bust. For comparison, the July unemployment rate in Texas was 4.0, and the rate for the U.S. was 3.9 percent.
Leading Economic Indicators
U.S. and Texas Leading Indexes Somewhat Mixed
The U.S. index of leading economic indicators extended its long growth trajectory in July (Chart 4). The Conference Board reported that improvements in the index were widespread across its components, suggesting the broader U.S. economy will continue to grow at a healthy pace the remainder of the year. This will likely be a tailwind for the Houston region, which sells a great deal of services and manufactured goods to the nation.

An initial estimate of the Texas Leading Index ticked up in July, though it is still down from where it was three months ago. The declines from April to June were mainly driven by the increase in the Texas value of the dollar (a drag on Texas, which is a major exporting state). The recent softness in the index suggests that state job growth is likely to slow in the second half of the year compared with a strong first half.
Locally Focused Indexes Mixed, Point to Growth
The Houston Purchasing Managers Index (HPMI) grew strongly in the first half of 2018 before surging to 62 in July, its highest value since February 2013 (Chart 5). The report indicated that energy (mining and pipelines), health care, professional services and wholesalers were noting expansion, while durable goods manufacturing was weakening. Despite the strong output growth, consistent with the Dallas Fed Texas Business Outlook Surveys, tariffs were noted as pushing up on prices and disrupting supply chains. The recent behavior of the index suggests job growth will likely pick up in the next few months.
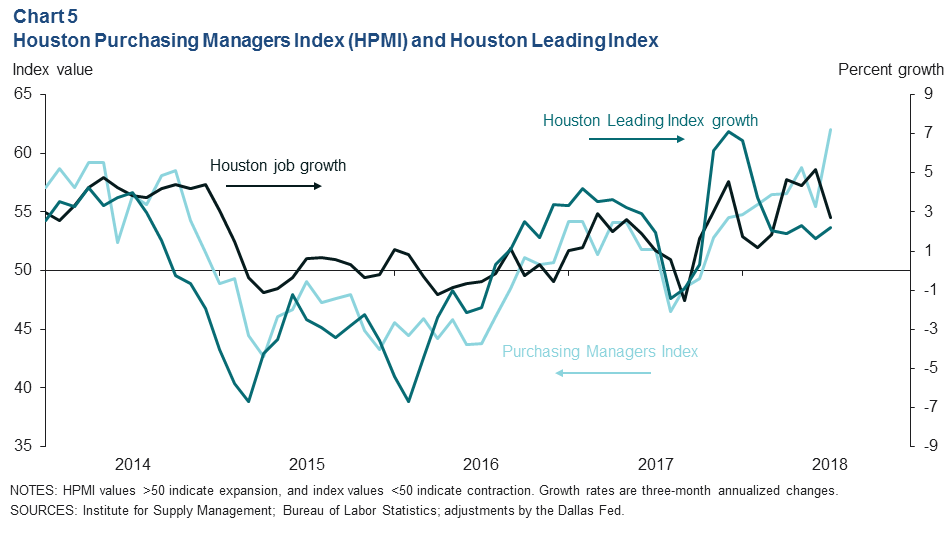
Growth in an index of 11 leading indicators for Houston was relatively steady in the most recent data, following strong post-hurricane growth. This index suggests that Houston job growth may slow in the second half of 2018, consistent with the Dallas Fed employment forecast.
Houston Leading Index Growth Broad Based Across Components
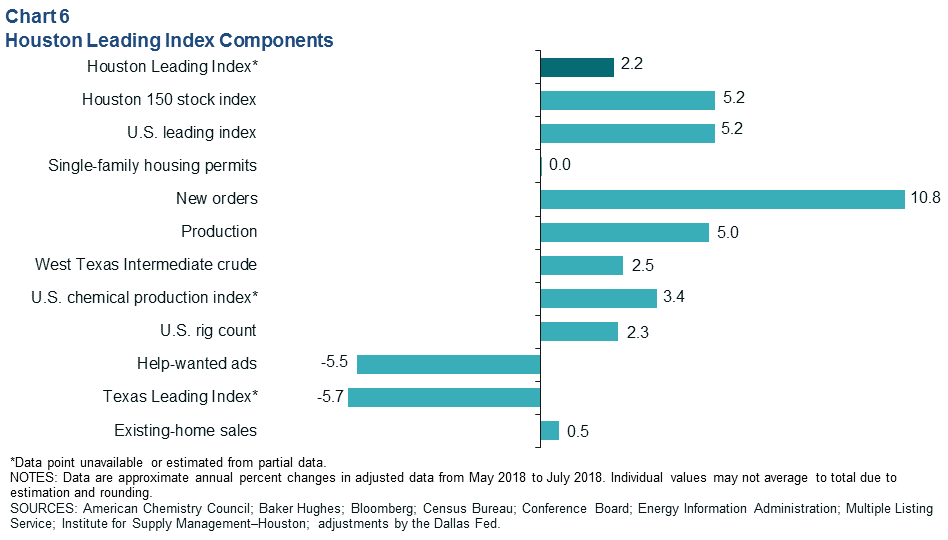
The Houston leading index grew an annualized 2.2 percent over the three months ending July 2018 (Chart 6). The underlying components showed broad-based increases. New orders from the HPMI logged the most significant annualized increases over the last three months, while job ads and the Texas Leading Index declined.
NOTE: Data may not match previously published numbers due to revisions.
About Houston Economic Indicators
Questions can be addressed to Jesse Thompson at jesse.thompson@dal.frb.org. Houston Economic Indicators is posted on the second Monday after monthly Houston-area employment data are released.