Houston Economic Indicators

Houston economic conditions remain mostly positive, as does the overall outlook for the area. The business-cycle index continues to exhibit strong growth, and the Houston Leading Index is accelerating. Existing-home sales have cooled slightly, while the supply of lower-priced homes remains tight. Construction labor demand is very strong, driven by petroleum industries and residential building.
Houston Business-Cycle Index
The Houston Business-Cycle index grew at an annual pace of 6.8 percent from June to September 2018, extending the healthy expansionary trend that characterized the first half of the year (Chart 1).
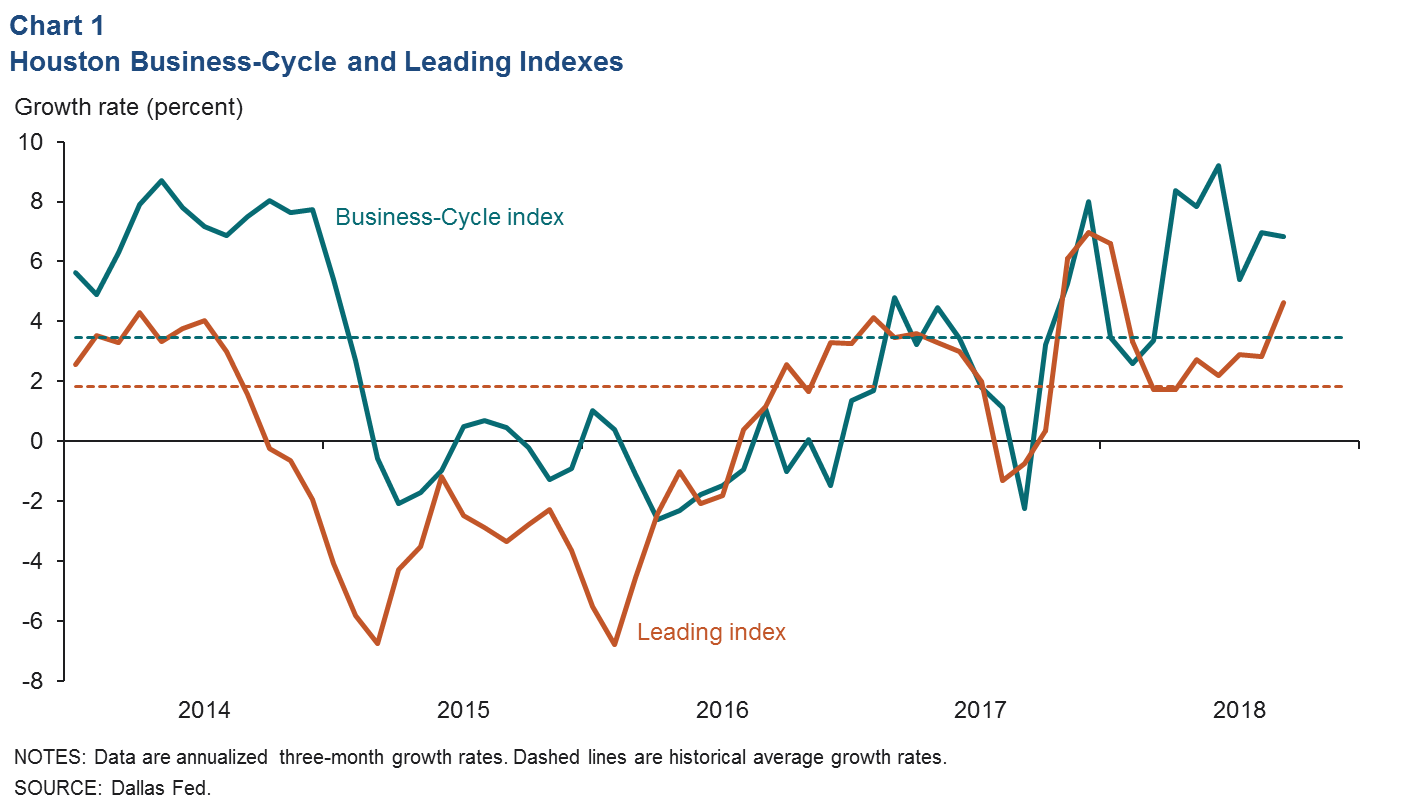
A leading index of 11 economic indicators for Houston grew at an annual pace of 3 percent from May to August despite a sharp drop in the contribution of oil and gas drilling to the index. That change in the index is supportive of above-average job growth through the remainder of the year. Historically, the average has been about 2.1 percent.
Employment
Strong Job Growth Across Most Sectors
Houston employment grew 3.9 percent over the three months ending in September (Chart 2). Construction (8,700 jobs) once again outpaced most other sectors. Manufacturing (6,200) and education and health services (4,900) also saw strong growth over that time. The smaller “other services” category that includes auto mechanics, dry cleaners and animal grooming (4,300) logged the fastest growth. Job losses over that time were limited to government (-2,200), almost entirely state government jobs.
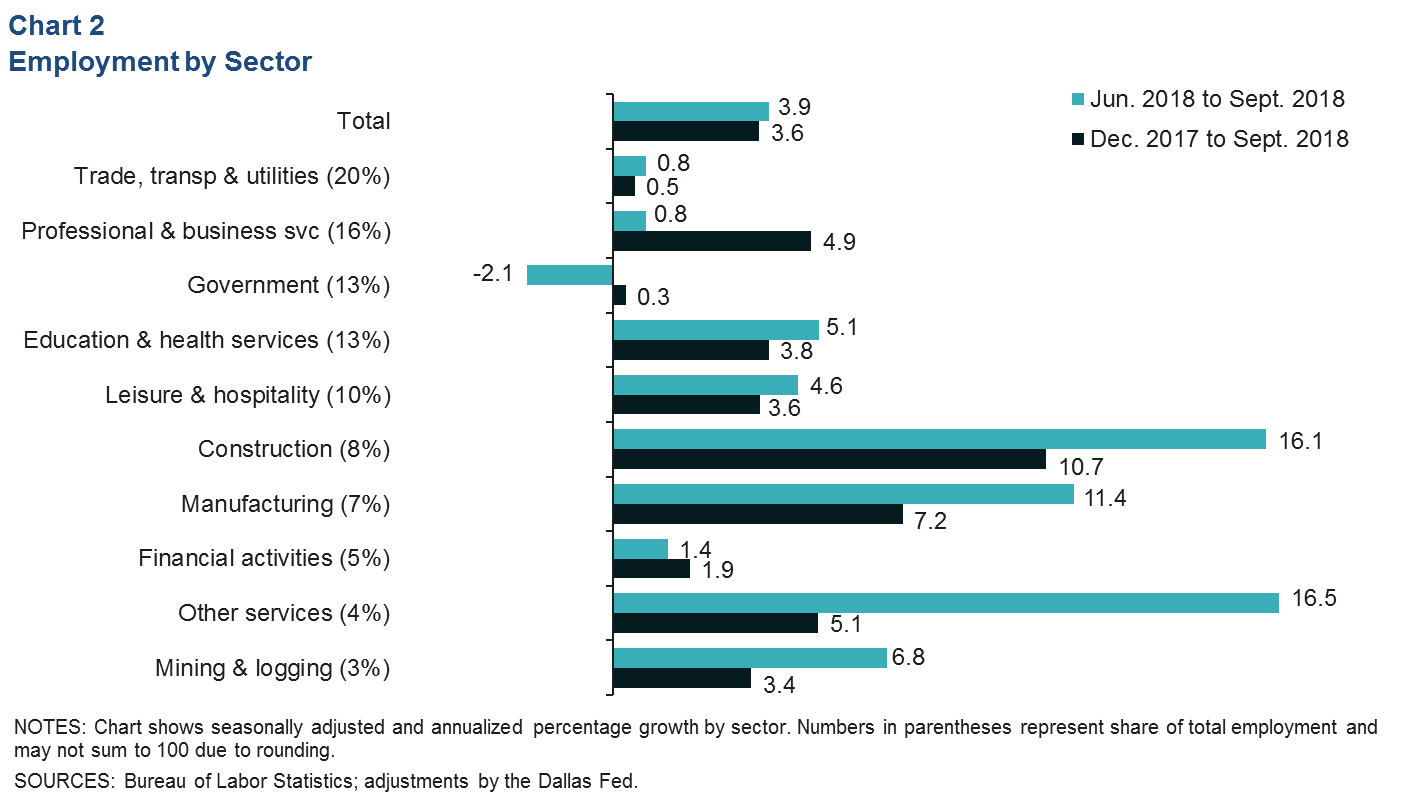
Year to date, Houston employment grew an annual 3.6 percent in September, or by 82,000 jobs. The largest contributors have been professional and business services—mostly from professional, scientific and technical services jobs (17,700)—and construction (17,300). Together, that puts the metro on pace to add over 109,000 jobs this year. However, data since March are still subject to substantial revisions.
The metro unemployment rate fell slightly to 4.1 percent in September. For comparison, the U.S. and Texas had unemployment rates of 3.8 percent and 3.9 percent, respectively.
Construction Jobs Surge
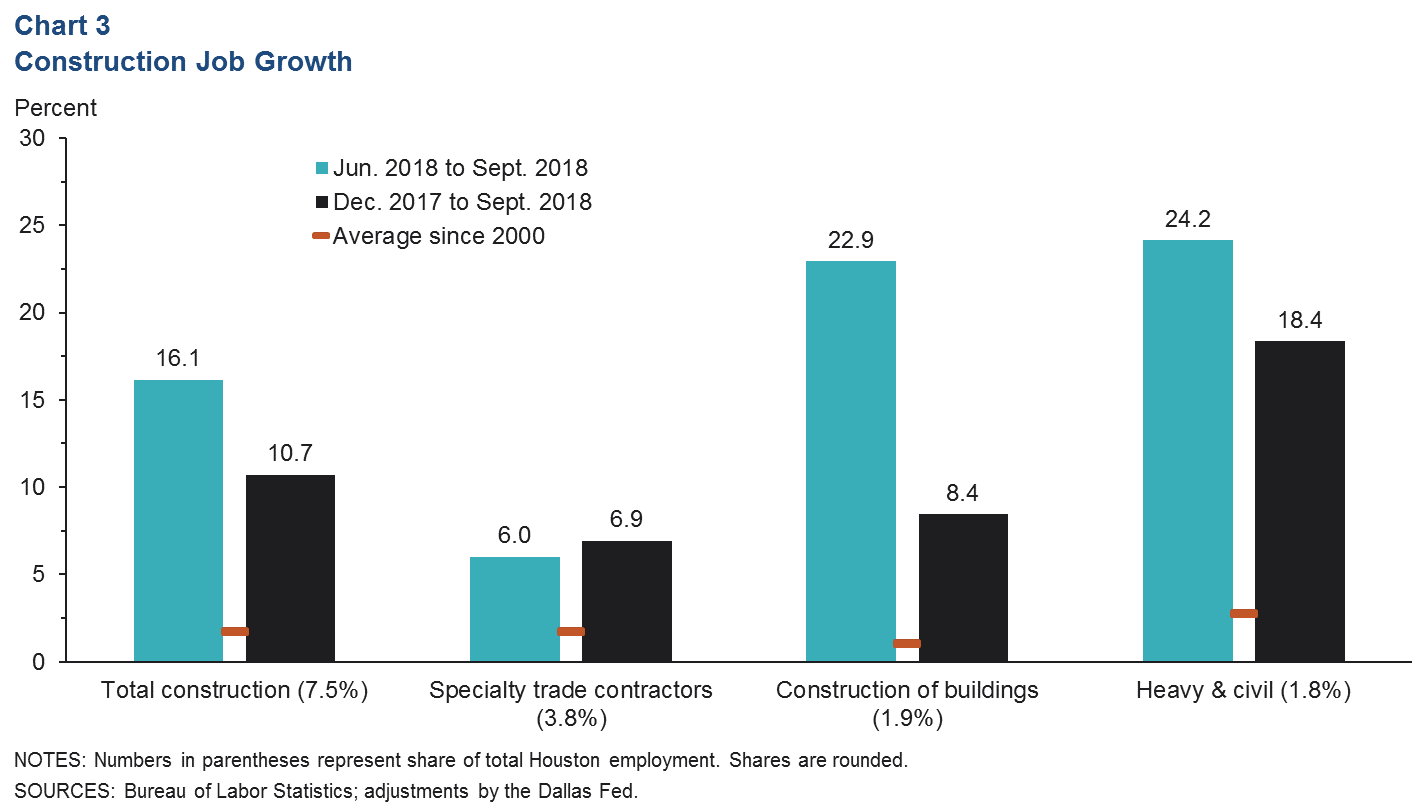
Construction employment accelerated over the three months through September, making for notable year-to-date gains. This was particularly true for heavy and civil construction (6,700 jobs year to date), which logged the fastest year-to-date growth, and construction of buildings (3,600), which accelerated markedly in recent data (Chart 3). Total new housing starts were up 7.2 percent year over year in the first half of 2018, and multifamily construction permits surged 147 percent over that time frame. However, the start-up of two large petrochemical construction projects in the metro and booming demand for pipeline and other midstream construction projects were also likely significant sources of recent demand for construction workers.
Real Estate
Existing-Home Sales Slip
Seasonally adjusted home sales averaged 7,137 for the three months ending in September, down slightly from the 7,339 in the prior three-month period. While the decline was sharpest for homes in the $500,000 to $749,999 range, 90 percent of homes sold in 2018 have been below that range (Chart 4). Cooling real estate markets are at least partly attributable to mortgage rates, which have risen nearly 1 percentage point over the past year.
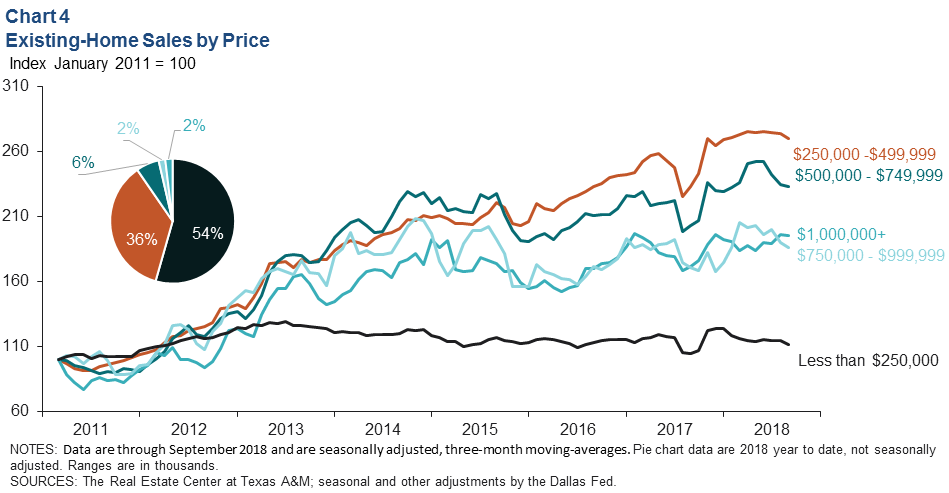
Looking at Houston markets by price point, divergent trends emerge. Since 2011, sales of existing homes nominally priced between $250,000 and $499,999 have seen strong demand growth, with home sales hardly pausing for the oil bust in 2015 and outpacing other price ranges. However, homes priced below $250,000 have seen sales decline since 2013. Many Houston homes appreciated into higher price categories, driven by a growing population (high demand growth) and a persistent dearth of new product (low supply growth) at lower price points over the past several years.
Data from Metrostudy, which tracks the new-home market, show that the share of total home starts priced under $200,000 declined from over 36 percent in 2013 to 13.6 percent in the first half of 2018. The share of vacant lots available to even start construction on lower-priced homes has fallen even further, an extension of a number of trends identified by the Dallas Fed as contributing to lower housing affordability over the past several years.
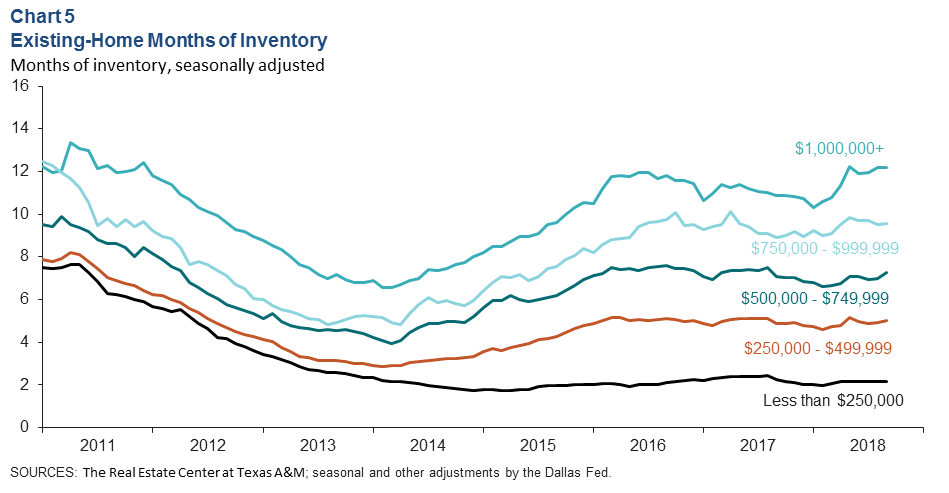
Inventories Rise for All but Lower-Priced Homes
The supply of existing homes (number of homes listed divided by the number of homes sold) rose slightly to 3.8 months overall. This metric is considered balanced between buyers and sellers when it’s six months; thus, the current market is considered tight.
Inventories varied considerably across housing price points. The lowest-priced homes had inventories of 2.2 months. Homes in the high-demand $250,000 to $499,999 and $500,000 to $749,999 price ranges saw inventories rise to 5.0 and 7.3 months, respectively, on softer sales in September (Chart 5).
Commercial Real Estate
The vacancy rate for office space ticked down for the first time since 2014 in third quarter 2018. Higher year-to-date job growth in professional and business services likely aided office absorption which, combined with low deliveries of new product, helped bend the curve on vacancy rates (Chart 6).
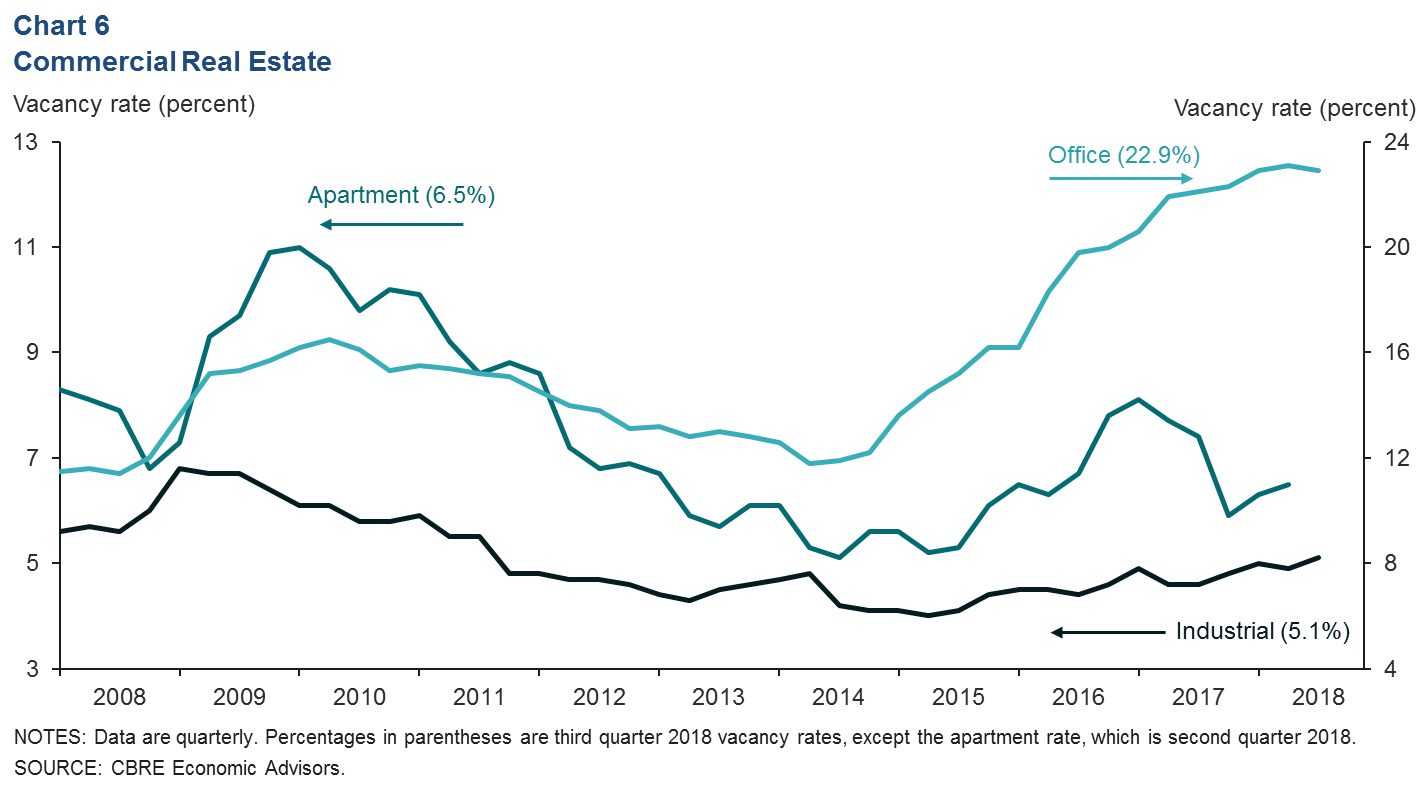
Industrial vacancies inched up in the third quarter, but that market remains tight. Apartment vacancies rose to 6.5 percent in the second quarter, and preliminary information for the third quarter indicates that they will rise again as Harvey victims continue to move back into their homes.
NOTE: Data may not match previously published numbers due to revisions.
About Houston Economic Indicators
Questions can be addressed to Jesse Thompson at jesse.thompson@dal.frb.org. Houston Economic Indicators is posted on the second Monday after monthly Houston-area employment data are released.