Houston Economic Indicators

The outlook for Houston softened as leading indicators broadly slowed over the past three months. Revisions to data from earlier in the year show that 2018 Houston employment growth has been healthy but not as strong as early estimates suggested. However, local labor force growth has outpaced other parts of the nation.
Employment
In the most recent early benchmark release, Houston jobs were revised down by more than 20,400 from the initial second quarter 2018 estimate. This substantially lowered Houston’s job growth from a booming annual 3.3 percent from December 2017 to October 2018 to a more modest 2.4 percent (Chart 1). While slower, growth is still above the historical average rate of 2.1 percent.
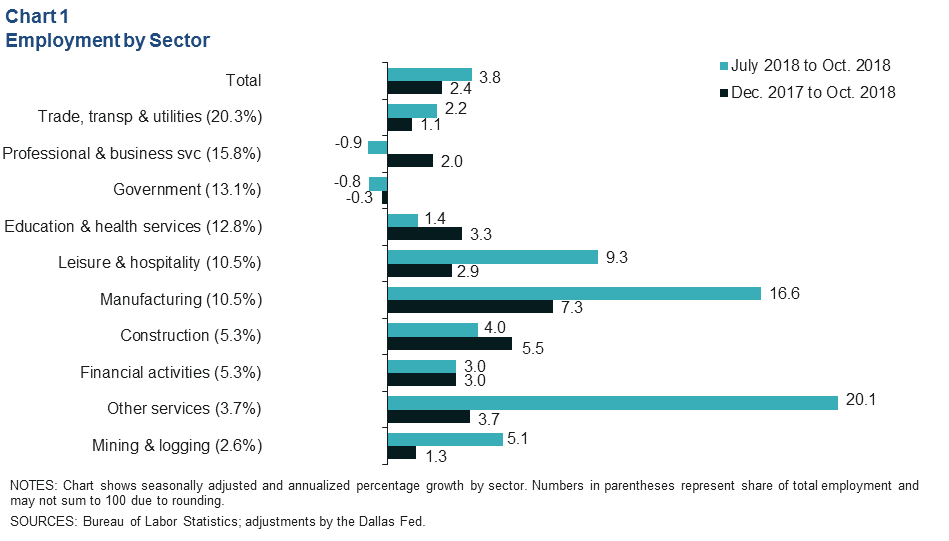
The revised year-to-date pace puts Houston on track to add about 73,000 jobs in 2018. The biggest revisions were in professional and business services and construction, which saw nearly 8,000 and 4,300 jobs removed, respectively. The chief drivers of year-to-date job growth are now manufacturing (13,500 jobs), education and health services (10,600, mostly health care workers), and construction (10,000).
More recent unrevised data suggest that job growth accelerated for the three months ending in October, increasing an annual 3.8 percent. Manufacturing (8,900) and leisure and hospitality (7,200) garnered the most gains over that period, while professional and business services (-1,100) and government (-800) registered losses.
Houston Leading Index
Index Suggests Slower Growth Ahead
The Houston Leading Index (HLI) growth rate slowed for the three months ending in October to 1.7 percent from 4 percent in September (Chart 2). Moderating growth in the index suggests that Houston payrolls will continue to expand more slowly through the next three to 10 months.
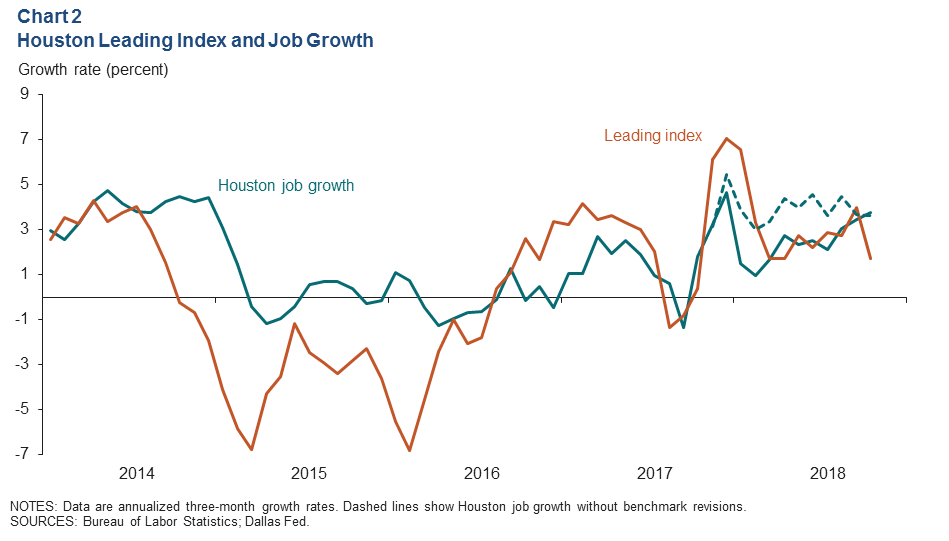
Comparing the unrevised job numbers from the Bureau of Labor Statistics to the Dallas Fed’s early benchmarked employment numbers suggests that job growth slowed more substantially after the post-Hurricane Harvey surge than the payroll survey initially suggested.
Deceleration Broad Based Across Leading Index Components
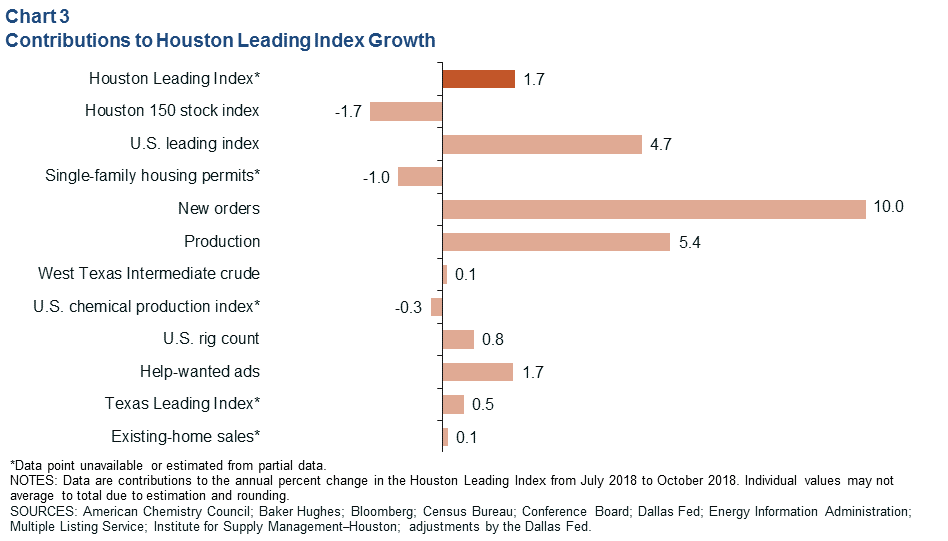
Contributions to growth in the HLI over the three months ending in October were led by the new orders and production components of the Institute for Supply Management’s Houston Purchasing Managers Index and by the Conference Board’s U.S. leading index (Chart 3). While the Bloomberg Houston 150 stock index and single-family permits were the main drags on the HLI over that time, the contributions from nine of the 11 components moderated compared with the three months ending in September.
U.S. and Texas Leading Indexes
The U.S. leading index from the Conference Board increased more slowly in October than in recent months, ticking up 0.1 percent as compared with 0.6 percent in September and 0.5 percent in August (Chart 4). This is the first substantial slowdown since May. The recent change suggests the U.S. economy will continue to grow in the months ahead but at a slower pace. As Houston’s economy has diversified over the last 30 years, the broader U.S. economy has become more important for local job growth. A waning in this index suggests a moderate letup of Houston’s job growth over the next six to eight months.
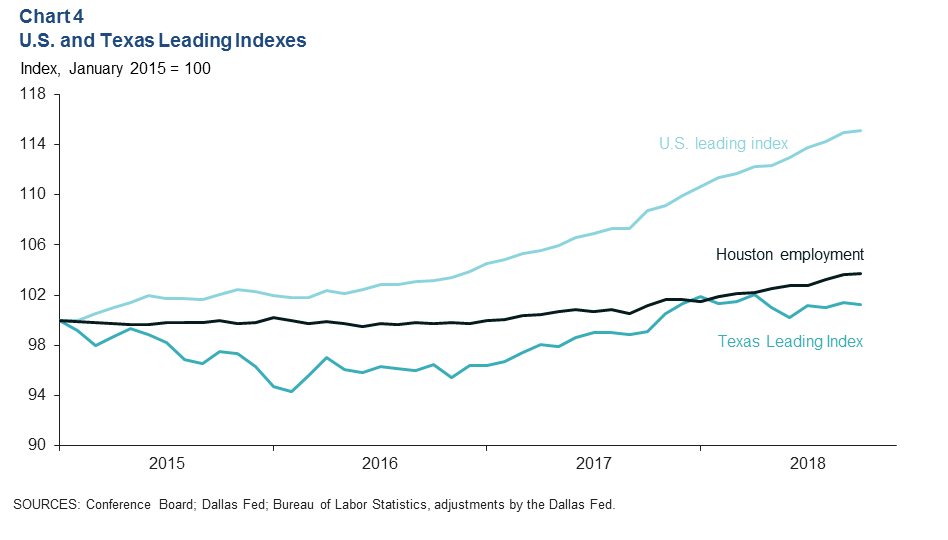
The Texas Leading Index continues to be supportive of local job growth. It grew 0.16 percent over the three months ending in October. Of the eight index components, falling initial claims for unemployment insurance did the most to help the index rise, while the increasing value of the Texas trade-weighted value of the dollar was the most significant drag on the index. The latter is particularly important for Houston, a major port region, as a rising dollar makes Texas exports less competitive on the global market.
Houston Purchasing Managers Index
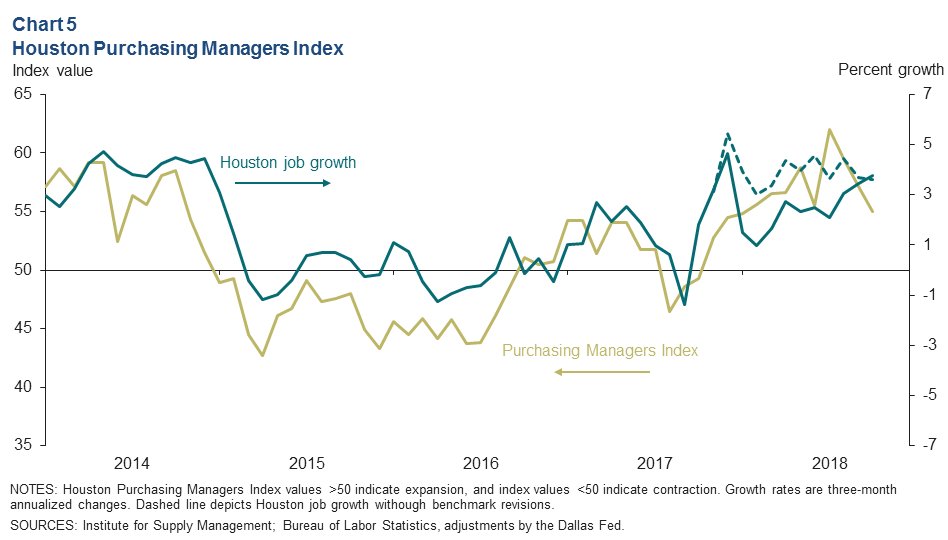
The Houston Purchasing Managers Index fell to 55 in October, the third consecutive month of decline (Chart 5). Values above 50 indicate an expansion for the index, and values over 45 are generally associated with a growing business-cycle index—a broad measure of economic activity produced by the Dallas Fed. By industry, expansion in the October survey was reportedly driven by health care, manufacturing, pipeline, and engineering, procurement and construction firms.
Labor Force
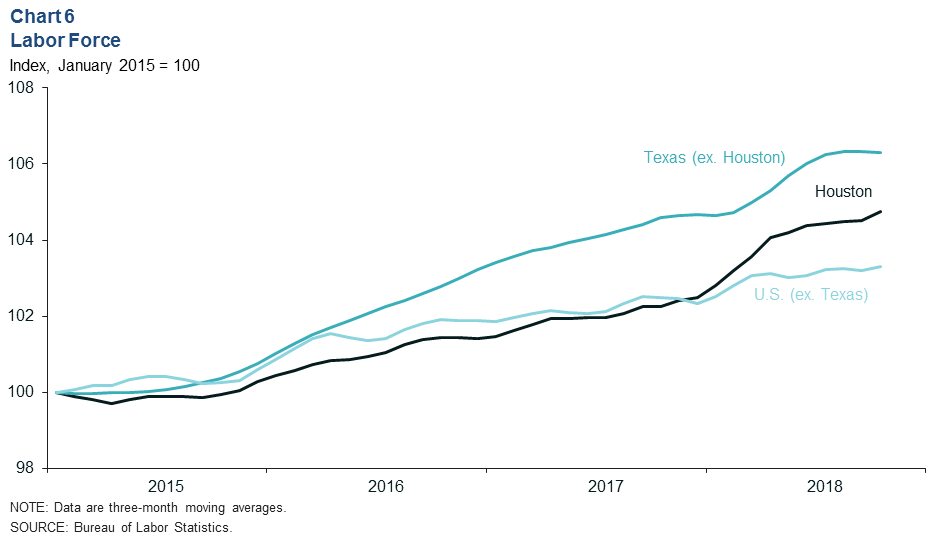
In October, the labor force rose by 20,000 workers, the largest increase since February 2018 and the second largest since April 2010 (Chart 6). Year to date, Houston’s labor force grew 2.7 percent. By comparison, the labor force grew 1.9 percent in the rest of Texas and 1.1 percent in the rest of the U.S.
Houston’s unemployment rate was 4 percent in October. The unemployment rates in both Texas and the U.S. were 3.7 percent.
NOTE: Data may not match previously published numbers due to revisions.
About Houston Economic Indicators
Questions can be addressed to Jesse Thompson at jesse.thompson@dal.frb.org. Houston Economic Indicators is posted on the second Monday after monthly Houston-area employment data are released.