Houston Economic Indicators

Houston employment and the business-cycle index continue to register healthy growth, and drilling activity has flattened at a high level. However, oil prices have fallen significantly and the Houston leading index fell to near neutral. Stock indexes are also down. Overall, the outlook for Houston has weakened but remains positive.
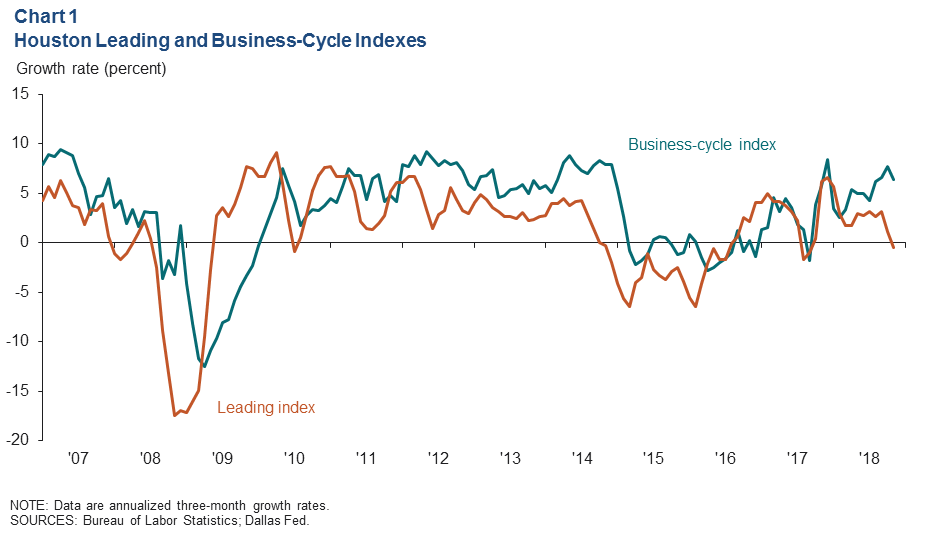
Business-Cycle and Leading Index
The Houston Business-Cycle Index grew at an annual rate of 6.4 percent over the three months ending in November, driven by healthy initial estimates of employment growth over that period (Chart 1). In contrast, growth in an index of 11 leading indicators for Houston dipped just below zero for the three-month period ending in November. That dip was driven by declines in the Houston stock index, crude oil prices, job ads and single-family construction permits. Together, the indexes suggest that economic activity in the Houston region has been strong but will likely slow in the months ahead.
Employment
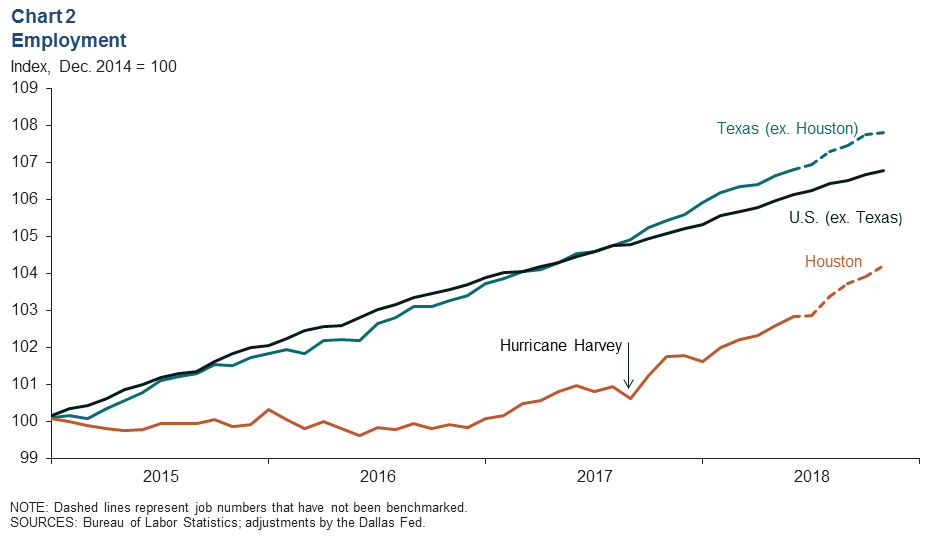
Texas and Houston Growth Outpaces U.S.
As Hurricane Harvey-related impacts to Houston job growth waned by early 2018, the region experienced a faster pace of growth than the rest of the state. Most of the acceleration occurred in the second half of the year, but that data is potentially subject to substantial revisions. Texas job growth overall outpaced the rest of the U.S. in 2018 (Chart 2).
Job Growth Broad Based Across Sectors
Houston added jobs at an annual rate of 3.3 percent (25,200 jobs) over the three months ending in November (Chart 3). The chief contributors to that growth were professional and business services (7,500), other services (4,700, which includes industries such as auto mechanics, laundromats and pet grooming) and manufacturing (4,700). Government jobs (-200) was the only category to decline.
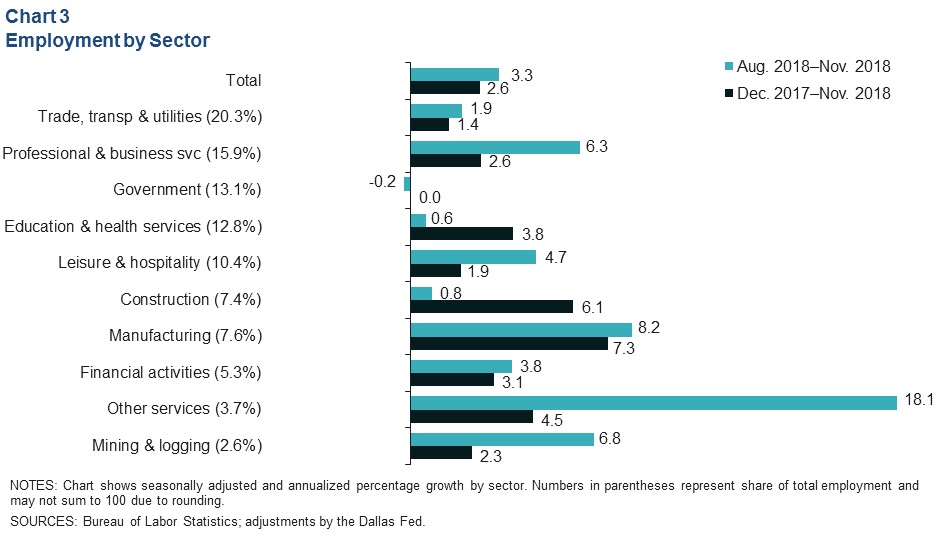
Taking a longer view, growth in 2018 was 2.6 percent through November (72,900 jobs), above the historical average of 2.1 percent. Manufacturing (14,900) and construction (12,100)—both boosted by rising demand from the oil and gas sector—were major contributors to that growth, along with education and health services (13,600).
The unemployment rate in Houston was 4 percent in November. By comparison, the unemployment rates in Texas and the U.S. were both 3.7 percent.
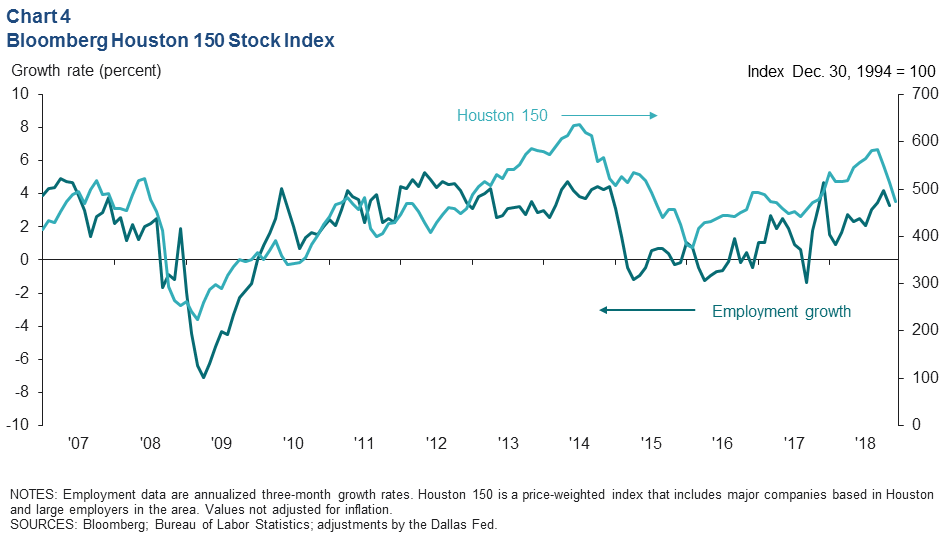
Houston 150 Stock Index
The Houston 150 stock index fell 109 points from its high in September to an average value of 474 in December 2018 (Chart 4). The nearly 19 percent drop was the largest over-the-quarter decline since global commodity prices collapsed at the end of 2008, a period when the Great Recession had already taken hold in the U.S. economy. The significant presence of oil and gas companies in Houston makes the index highly correlated with the S&P 500 Energy index (also down 19 percent). In context, the broader S&P 500 has not done well over the fourth quarter either, dropping about 12 percent. The decline in stock prices of Houston companies suggests slower earnings growth in the future, likely leading to less-robust job growth.
Energy
Drilling Essentially Flat as Oil Prices Plunge
Drilling activity in the U.S. was up only slightly over the second half of 2018, constrained in part by limited pipeline capacity in the Permian Basin (Chart 5). The price of West Texas Intermediate (WTI) crude oil peaked in October near $71 per barrel and has since fallen to an average of under $50 in December. It reached as low as $42 on Dec. 24. Changes in aggregate drilling activity generally lag behind changes in monthly prices by about three months. Recent prices suggest drilling activity should drop at least slightly in early 2019.
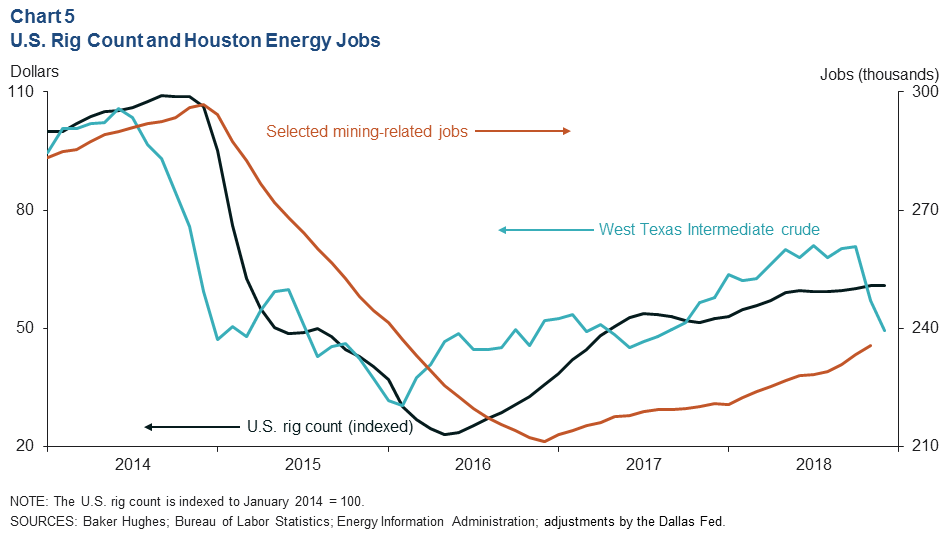
Nonetheless, results from the fourth quarter Dallas Fed Energy Survey suggest that drilling firms are likely to increase spending in 2019. This is due in part to scheduled increases in pipeline capacity next year that will improve the prices oil producers in the Permian Basin actually receive. However, should oil prices persist near or below year-end 2018 levels, planned expenditures may be trimmed.
Mining-Related Job Growth Accelerates
Mining-related job growth—changes in industry sectors that have significant ties to oil and gas production—accelerated over the three months ending in November to an annual rate of 11.7 percent (6,400 jobs). This increase was led by fabricated metals (2,700) and mining machinery manufacturing (1,400) (Chart 6).
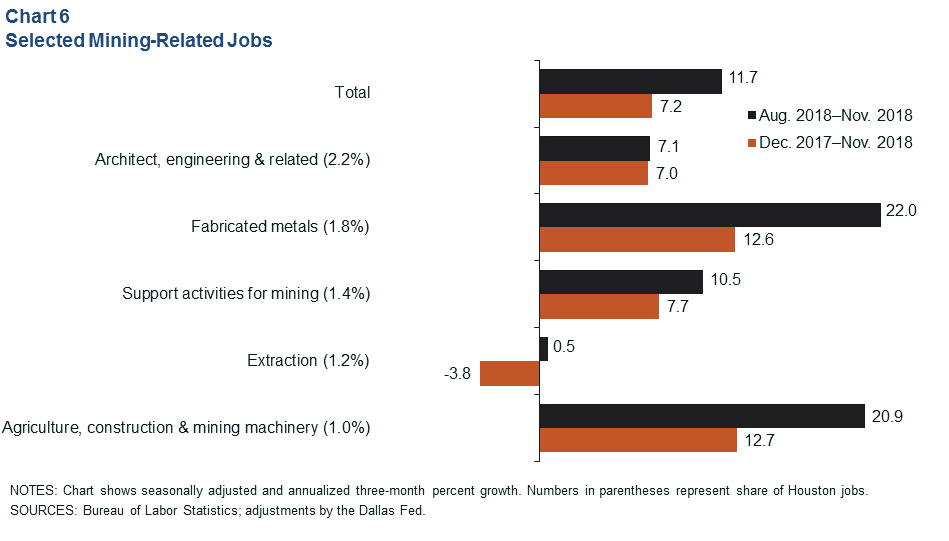
Fabricated metals and support activities for mining (1,000) are the most cyclical. When drilling activity changes, these sectors would be the first to respond. Mining extraction—comprising mostly oil and gas exploration and production firms—has been in retreat in Houston as consolidation and cost-cutting efforts eroded the white-collar job count in head offices in Houston, even as services and manufacturing jobs grew.
Engineering services has seen solid growth in 2018, driven by oil and gas operations, new pipeline and related investments, export capacity and petrochemical industry project demand.
NOTE: Data may not match previously published numbers due to revisions.
About Houston Economic Indicators
Questions can be addressed to Jesse Thompson at jesse.thompson@dal.frb.org. Houston Economic Indicators is posted on the second Monday after monthly Houston-area employment data are released.