Houston Economic Indicators

Recent data for Houston are mixed, but they continue to paint a moderately positive outlook for the region. Leading and coincident indexes for Houston improved, and job growth accelerated. Existing-home sales rose, but permits for single-family housing units were down. While the vacancy rate for apartments has recently increased, the number of permits to build new multifamily units has continued to surge. New census data show that Houston population growth slowed last year.
Business-Cycle and Leading Indexes
The Houston Business-Cycle Index accelerated to a 4.9 percent growth rate for the three months ending in March, above its historical average pace of 3.5 percent (Chart 1). Driven by stronger job numbers, this suggests that the pace of the regional economy has picked up.
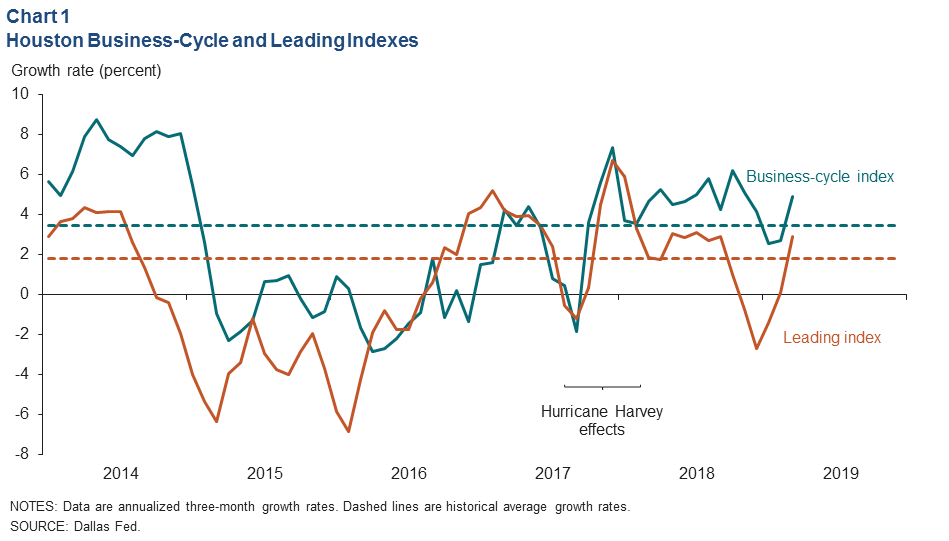
A separate index of 11 leading indicators for Houston grew 2.9 percent from December 2018 to March 2019. This implies stronger job growth ahead, particularly over the next six months.
Employment
The initial estimate for employment growth for the three months ending in March was 2.6 percent (20,200 jobs), up from 1.6 percent and 1.1 percent for the three months ending in February and January, respectively. The biggest contributors to the recent growth were professional and business services (6,900) and manufacturing (4,764). The fastest-growing sector was other services (4,100), which includes such varied services as auto mechanics, laundry services and animal boarding (Chart 2). The only two sectors to contract were trade, transportation and utilities (-1,100) and construction (-3,200). So far this year, all of the major construction subsectors have lost jobs, including heavy and civil engineering, which accounted for most of the construction employment growth in 2018.
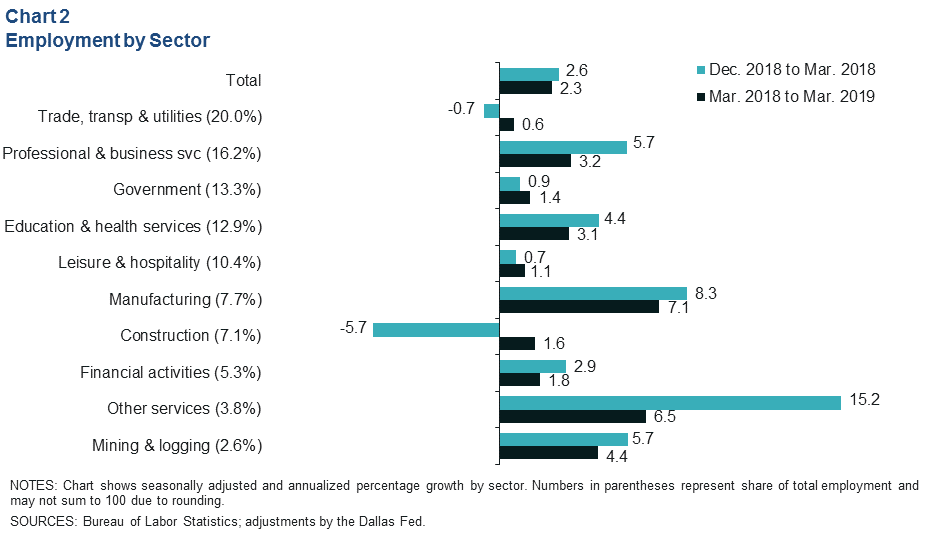
Taking a longer view, employment growth from March 2018 to March 2019 was 2.3 percent (70,332 jobs). The growth was broad based and led by gains in manufacturing (15,900) and professional and business services (15,500).
The unemployment rate in Houston was 3.8 percent in March, down from 4.3 percent in January, as gains in the number of employed people outstripped flattening labor force gowth. The March unemployment rates in Texas and the U.S. overall were also 3.8 percent.
Population
Houston population growth slowed to 1.3 percent, or 56,119 people, between July 2017 and July 2018 (Chart 3). That is down from 1.4 percent, or 61,537 people, for the prior year. The modest deceleration was mostly driven by a drop in the number of births. For reference, the average annual growth rate for Houston was nearly 2.2 percent from 2000 to 2018 and nearly 2.1 percent between 1980 and 2000.
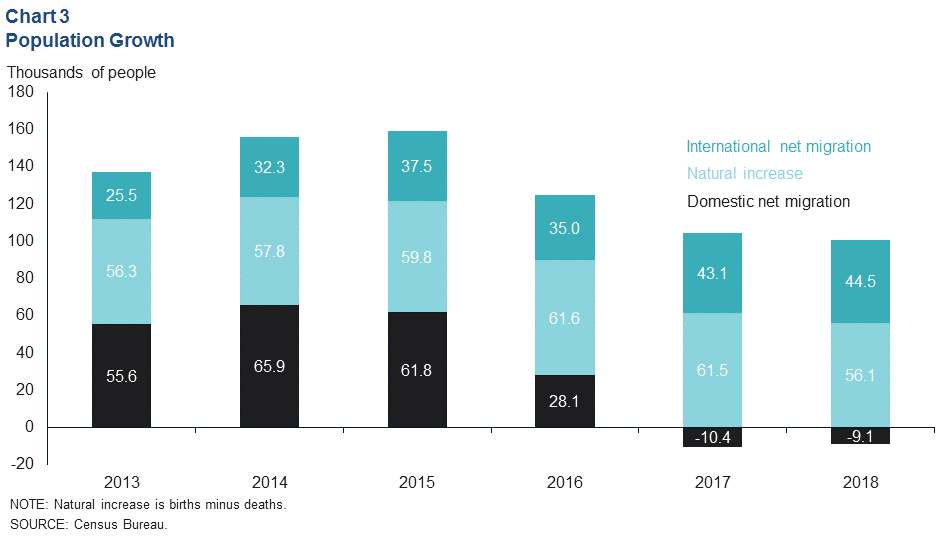
2018 was the second year in a row in which more people migrated out of Houston to other parts of the U.S. than migrated into the region from other parts of the country, and it was the third consecutive year of reduced population growth. The oil bust, rising employment elsewhere in the U.S. and Hurricane Harvey were likely contributing factors to the softening domestic net migration numbers.
Housing
After eroding for most of 2018, the total number of existing homes sold in Houston ticked up in March to 7,221 on a seasonally adjusted basis (Chart 4). Higher mortgage rates, recent oil price volatility and lingering issues associated with flooding from Hurricane Harvey likely contributed to softness last year. Recent drops in mortgage rates are in part boosting sales so far in 2019.
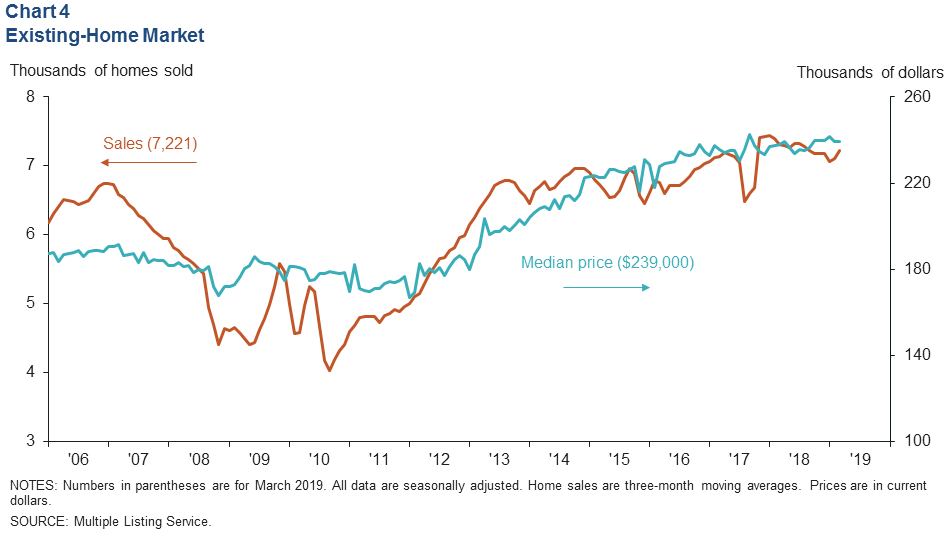
Houston’s housing market remained modestly tight at 4.1 months of inventory in March, up from 3.5 months a year ago. Historically, these markets have been considered balanced between buyers and sellers at six months. The median price of homes sold was $239,000 in March, on par with price levels that have persisted the past six months.
Commercial Real Estate
The Houston office vacancy rate drifted down to 21.5 percent in first quarter 2019, its fourth consecutive decline after peaking at 23 percent in second quarter 2018 (Chart 5). The tight industrial market saw vacancy rates rise to 5.3 percent, extending a near four-year modest upward trend.
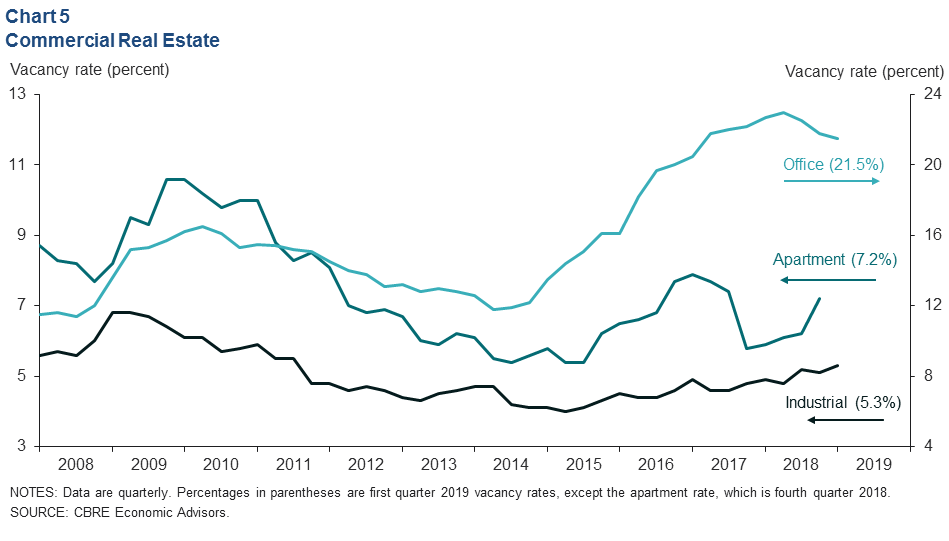
Apartment vacancy rates rose precipitously in fourth quarter 2018 to 7.2 percent. Net absorption—the change in the number of units occupied, accounting for newly completed units and units vacated—dipped to -5,256 units. It was the sharpest drop in net absorption since first quarter 1997. The rise in the vacancy rate occurred with only 882 new unit deliveries and may be associated with Hurricane Harvey victims returning to their homes.
Residential Building Permits
Construction permits for multifamily housing units dipped for the three months ending in March to 2,056 after surging at the start of 2019 (Chart 6). The high levels registered this past February were surpassed only by August 2014—a surge fueled by a dearth of construction following the housing bust, plus strong postrecession population growth and a booming local economy.
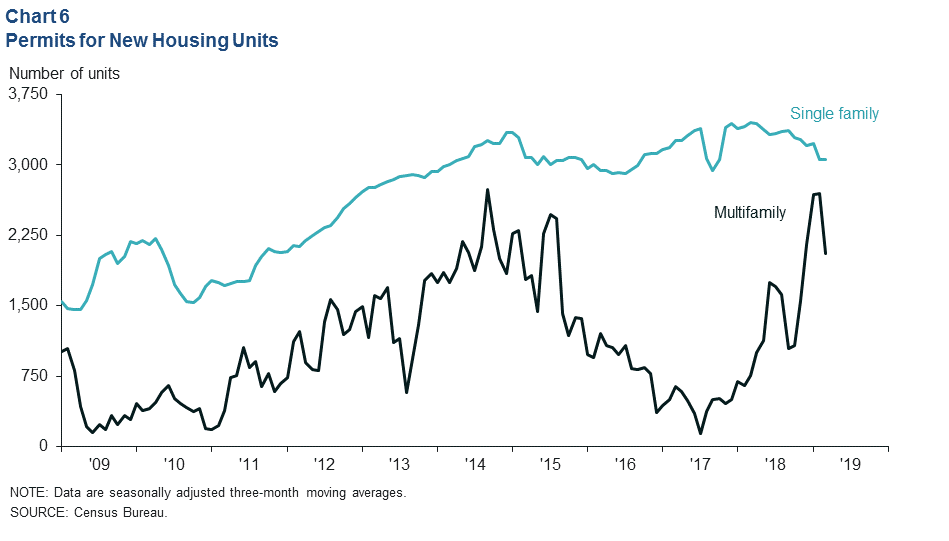
Permits for single-family housing units dropped to an average of 3,062 for the three months ending in March. Excluding the month of Hurricane Harvey in 2017, single-family permit activity so far in 2019 has been the lowest since late summer 2016.
NOTE: Data may not match previously published numbers due to revisions.
About Houston Economic Indicators
Questions can be addressed to Jesse Thompson at jesse.thompson@dal.frb.org. Houston Economic Indicators is posted on the second Monday after monthly Houston-area employment data are released.