Houston Economic Indicators

Job growth estimates remain healthy despite a recent downward revision. Manufacturing output has weakened in recent months and jobs in that sector are declining. Multiple indicators that tend to lead the local, state and national economies have also shown signs of slowing in recent months, affirming a slightly more moderate growth outlook for the local economy through the end of the year.
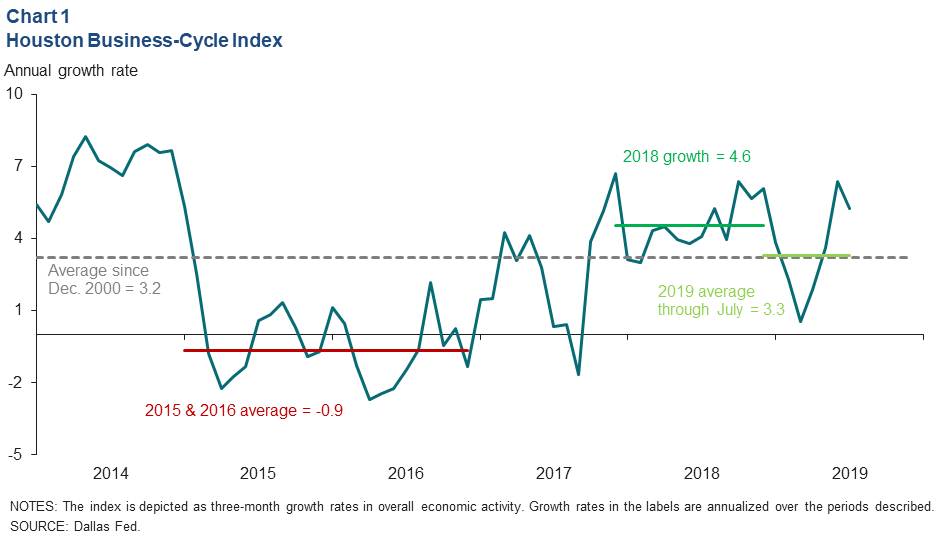
Business-Cycle Index
The Houston Business-Cycle Index grew 5.3 percent over the three months ending in July (Chart 1). However, incorporating a downward revision to first quarter 2019 employment data caused the index to slow substantially to an annual pace of 3.3 percent this year through July. This is just above the index’s historical average rate but down substantially from the 5.6 percent year-to-date rate prior to the revision and incorporating data through June.
Employment
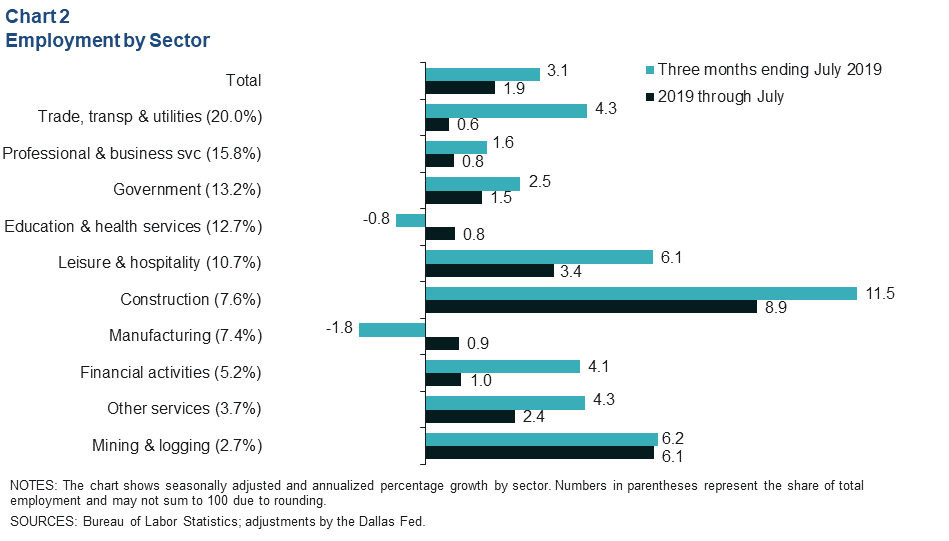
Houston jobs grew 3.1 percent over the three months ending in July (Chart 2). Construction (6,500 jobs) logged the fastest growth rate over that period, but net job gains were largest in trade, transportation and utilities (6,700). Leisure and hospitality (4,900) and government (2,600) were the other top contributors to job growth. Manufacturing (-1,000) and education and health services (-800) were the only sectors to decline over that period.
Revisions to first-quarter data erased nearly 15,000 jobs from Houston’s payroll count. In light of this, Houston employment has grown at an annual pace of 1.9 percent in 2019. That is slightly below the historical average annual growth rate of 2.1 percent.
The unemployment rate in Houston rose to 3.8 percent in July from 3.6 percent in June. The metro-area labor force grew an annual 2.8 percent in July as well, the fastest monthly pace since December 2018. The July U.S. unemployment rate was 3.7 percent, and Texas overall held at its record low of 3.4 percent.
Manufacturing
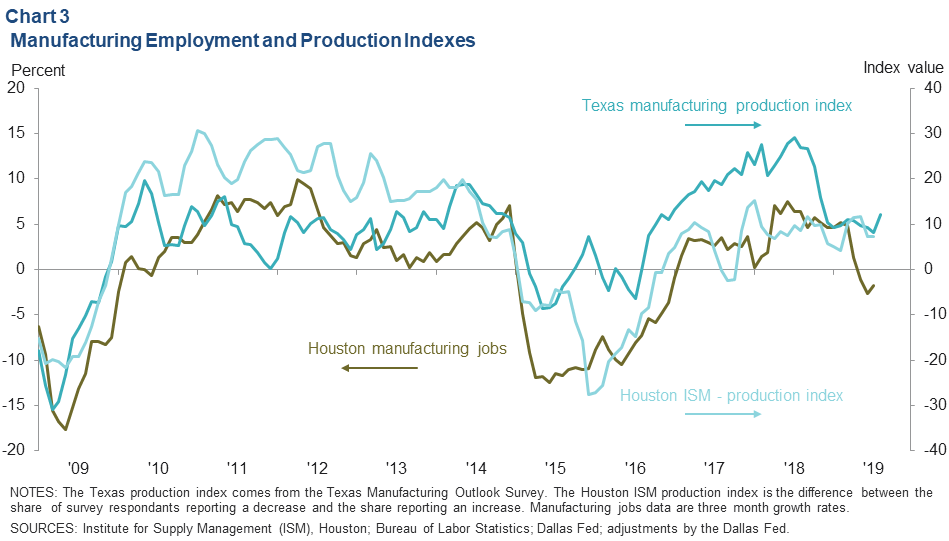
Houston’s manufacturing sector shed 1,579 jobs from March to July (Chart 3). Manufacturing employment tends to follow changes in manufacturing output, which by one state measure began declining late last year, but by a local measure began weakening only a few months ago.
The Dallas Fed’s Texas Manufacturing Outlook Survey production index fell markedly toward the end of 2018 and is trending just above its postrecession average of 9.6 so far in 2019, with a healthy reading in August. For the three months ending in August, the index average was 12. The Houston Institute for Supply Management production index—depicted as the difference between the share of respondents reporting a month-to-month increase in production and the share reporting a decrease—has weakened less sharply since 2018, falling to 7.0 in July, below its postrecession average value of 9.3.
Leading Indicators
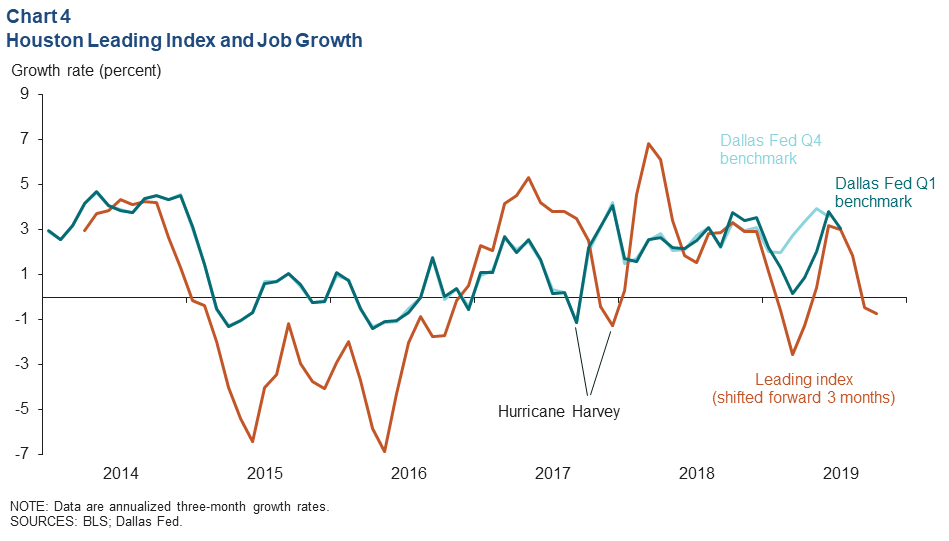
Houston Index Points to Slower Job Growth
Revised U.S. employment data for first quarter 2019 more closely reflect the growth pattern that an index of 11 leading indicators for Houston showed in fourth quarter 2018, which is seen by shifting the leading index forward three months (Chart 4). Growth in the index slipped to an annual -0.7 percent over the three months ending in July. The dip continues to suggest that employment growth in the remainder of 2019 should slow.
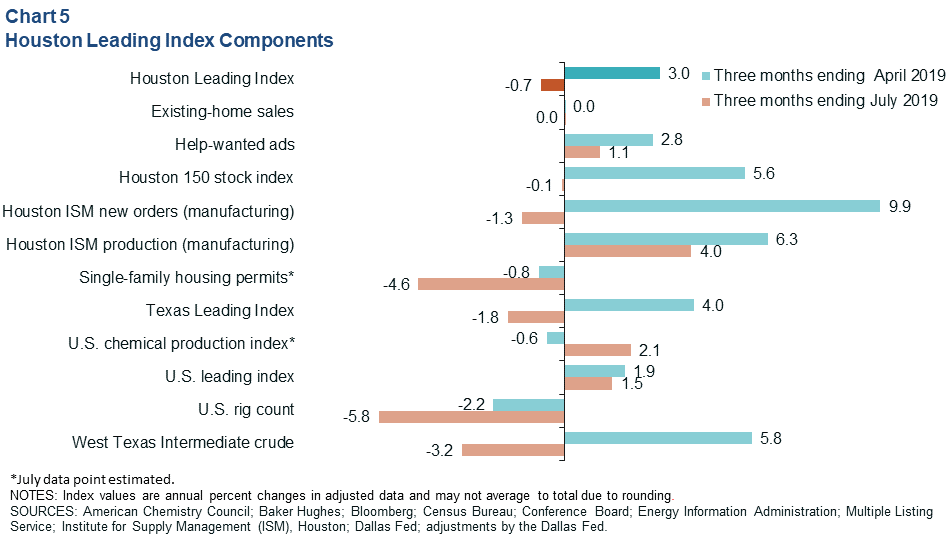
Slowing Seen Across Leading Indicators
The Houston leading indicators turned broadly negative over the three months ending in July. The U.S. rig count, single-family building permits and West Texas Intermediate crude oil prices were the biggest drags on the aggregate index over that time frame (Chart 5). Compared with the previous period, four leading indicators flipped from growth to contraction, the most notable being new orders for manufacturing. That component went from an annual 9.9 percent growth rate in the three months ending in April to a 1.3 percent contraction over the three months ending in July.
U.S. and Texas Indexes Suggest Moderate Growth
The U.S. leading index has only logged modest increases since effectively plateauing in 2018, but the index managed to pick up 0.5 percent in July after two slightly negative months (Chart 6). The improvement was driven by housing permits, unemployment insurance claims, stock prices and a leading credit index. Manufacturing and an inverted yield curve were drags on the index. Together, the readings suggest that moderate growth is likely to continue in the U.S. over the remainder of 2019.
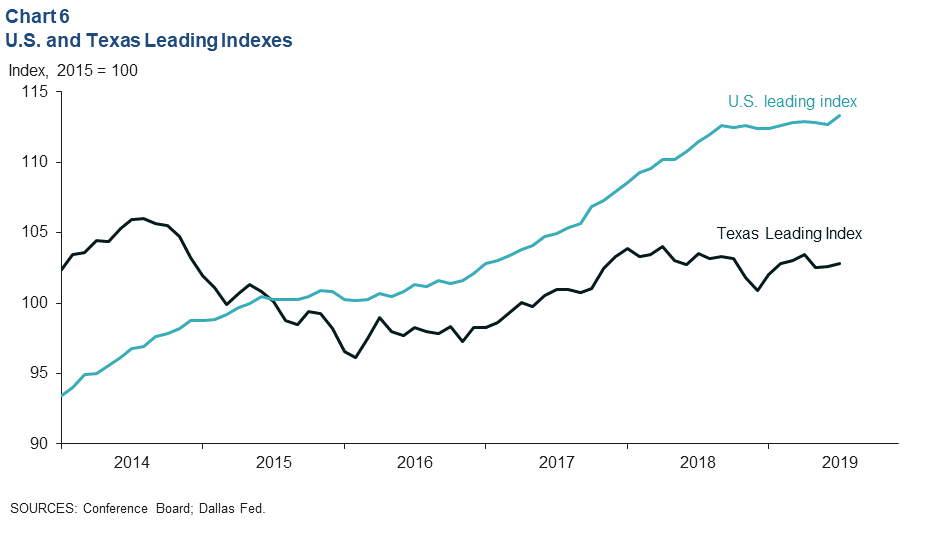
The Texas Leading Index dropped 0.6 percent over the three months ending in July. Unemployment insurance claims, weekly hours worked in manufacturing, and oil prices were the main drivers of the modest dip. Recent index changes and state employment data contributed to the Dallas Fed’s forecast of 2.6 percent job growth in 2019. However, downward revisions to first-quarter state employment data may slightly reduce that growth outlook.
NOTE: Data may not match previously published numbers due to revisions.
About Houston Economic Indicators
Questions can be addressed to Jesse Thompson at jesse.thompson@dal.frb.org. Houston Economic Indicators is posted on the second Monday after monthly Houston-area employment data are released.