Houston Economic Indicators

September 4, 2020
Indicators for Houston employment, unemployment and manufacturing improved in July. Leading and coincident indexes also showed gains. Higher-frequency data on mobility and engagement point to a tepid end-of-summer recovery from a COVID-19-driven midsummer lull. Taken together, the data suggest that Houston continues to make strides toward economic recovery, but the pace has likely slowed.
Business-Cycle and Leading Indexes
The Houston Business-Cycle Index surged 17.1 percent over the three months ending in July as pandemic-induced restrictions on the local economy were relaxed (Chart 1). The improvement was driven by sharp increases in payroll numbers and positive unemployment data.
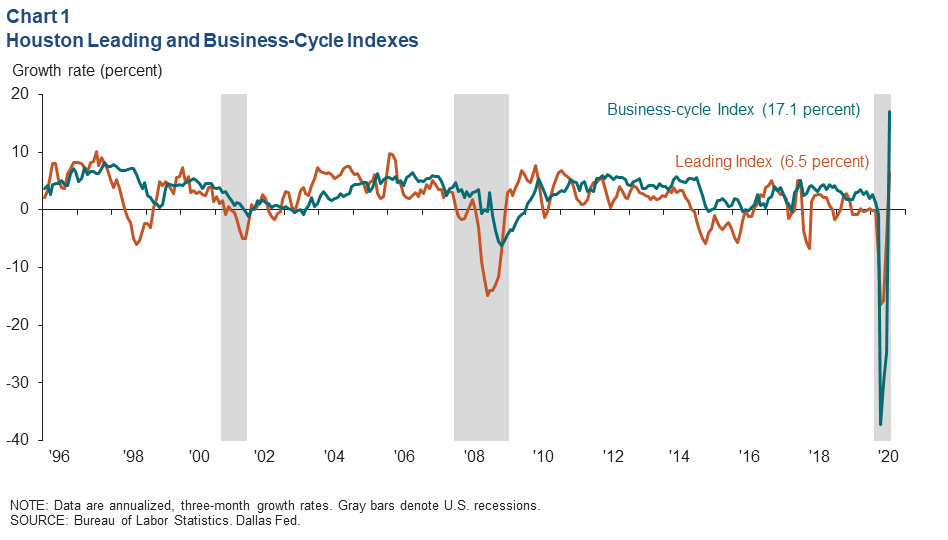
An index of 10 leading indicators for Houston climbed 6.5 percent over the three months ending in July. The improvement was broad based over that time except for the U.S. rig count and new equipment orders for manufacturing. While indicative of economic and job growth ahead, the index cannot account for how changes in COVID-19 cases, hospitalizations and containment policies will affect economic outcomes. New daily cases and hospitalizations are trending down in Houston, but it would undermine the positive local outlook if the virus were to gain momentum again.
Employment
30 Percent of Pandemic Job Losses Recovered
Houston added over 106,600 jobs from April to July, recovering 30 percent of the jobs lost between February and April (Chart 2). The largest gains were in leisure and hospitality, which added back 63,400 jobs—48 percent of jobs lost to the pandemic—even though bars were again shut down in late June to control the increased spread of COVID-19. Education and health services added 27,800 jobs (led by ambulatory health care). Trade, transportation and utilities (led by retail) rounded out the sectors adding back the most jobs. The mining sector saw further payroll declines in the months after April.
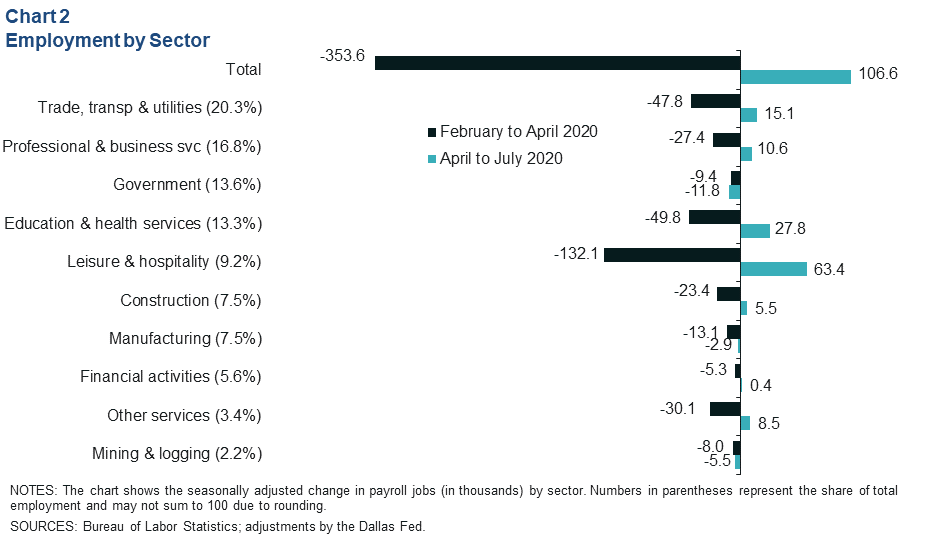
Payroll surveys are subject to multiple revisions over the year, so the details and magnitude of recent employment numbers may change substantially. However, numerous indicators suggest that the region did see substantial improvement from April to July.
The unemployment rate in Houston fell to 8.4 percent in July, compared with 8.0 percent for Texas and 10.2 percent for the U.S.
Initial Claims Still Trending Down
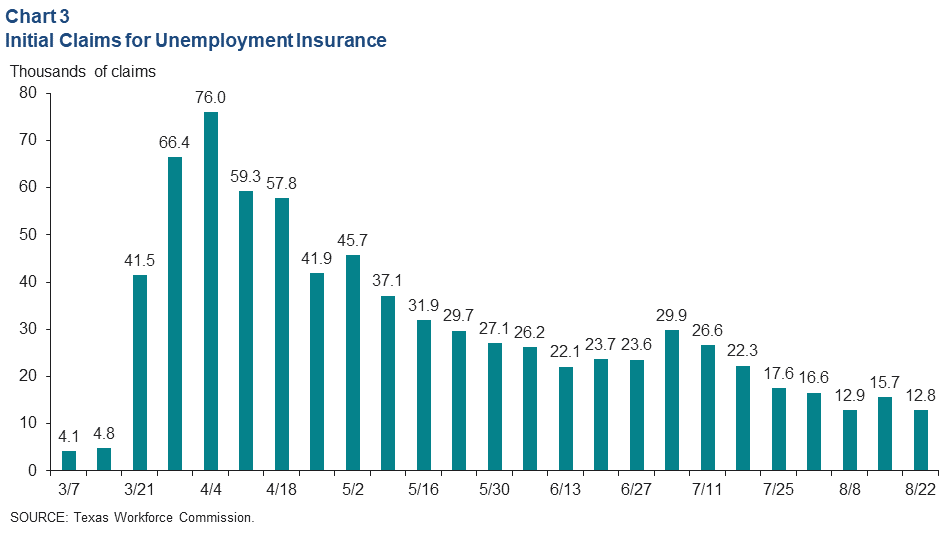
Weekly initial unemployment claims ticked down by nearly 3,000 to 12,800 in late August, an extension of the downward trend that began in April (Chart 3). That trend was briefly interrupted in early July when limitations on bars were reinstated amid a sharp rise in COVID-19 cases, hospitalizations and deaths. Since that time, the week-to-week declines appear to be narrowing.
Mobility and Engagement Indexes
Mobility and Engagement Indexes (MEIs), particularly for Houston and Texas, dipped in July before slowly climbing back toward mid-June levels by the end of the summer (Chart 4). The weakening was associated with worsening statistics for COVID-19 and the reimposition of some restrictions to combat the virus. MEIs have been highly correlated with a number of economic outcomes during the pandemic. The partial recovery of these indexes over the summer likely means that economic recovery in Houston is regaining momentum. However, it is not clear to what extent increases in the index may be due to end-of-summer seasonal trends.
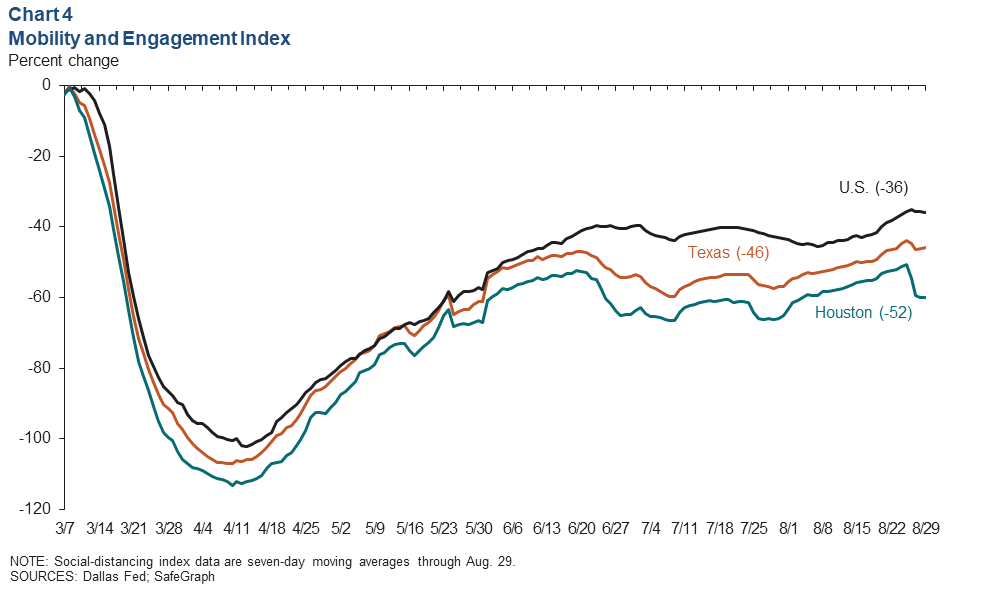
The Houston MEI declined sharply in the final week of August—similar to mobility in Louisiana—in contrast with most of Texas. This is most likely due to Hurricane Laura, which made landfall as a Category 4 hurricane near the Texas and Louisiana border but affected coastal counties from Galveston to New Orleans.
Manufacturing Indexes and Jobs
Manufacturing Output Increasing
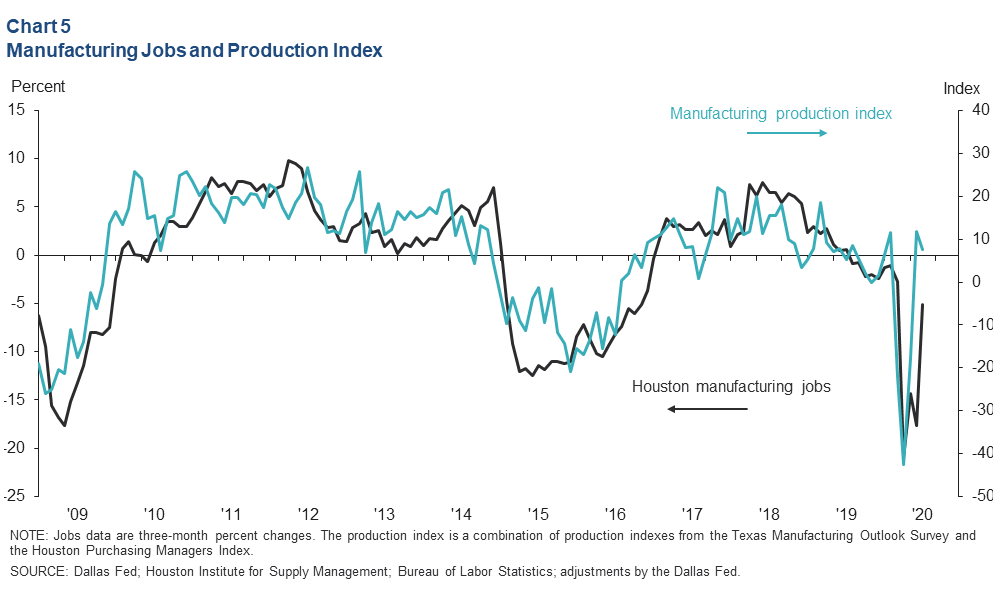
Changes in manufacturing production tend to lead manufacturing job growth, particularly at turning points in the economy. Houston production can be gauged by combining production indexes from the Texas Manufacturing Outlook Survey and the Houston Purchasing Managers Index (PMI). The combined index had a positive value of 7.7 for July, indicating that manufacturing output had increased modestly for the second month in a row after sharply declining for three months (Chart 5). This implies that manufacturing employment growth is also likely to increase over the next few months after dropping an annualized 2.9 percent over the three months ending in July.
Global Manufacturing Bodes Well for Houston Exports
Houston exports many intermediate goods such as plastics, machine parts, electronic components and energy that feed into manufacturing supply chains around the world. The aggregate PMI for emerging economies from IHS Markit reached 52.5 in August, signifying that manufacturing activity in places like China or Brazil had begun to grow again in aggregate (values above 50 indicate growth) (Chart 6). Developed economies climbed to 51.2, meaning that manufacturing had likely bottomed out by July and had begun to grow again.
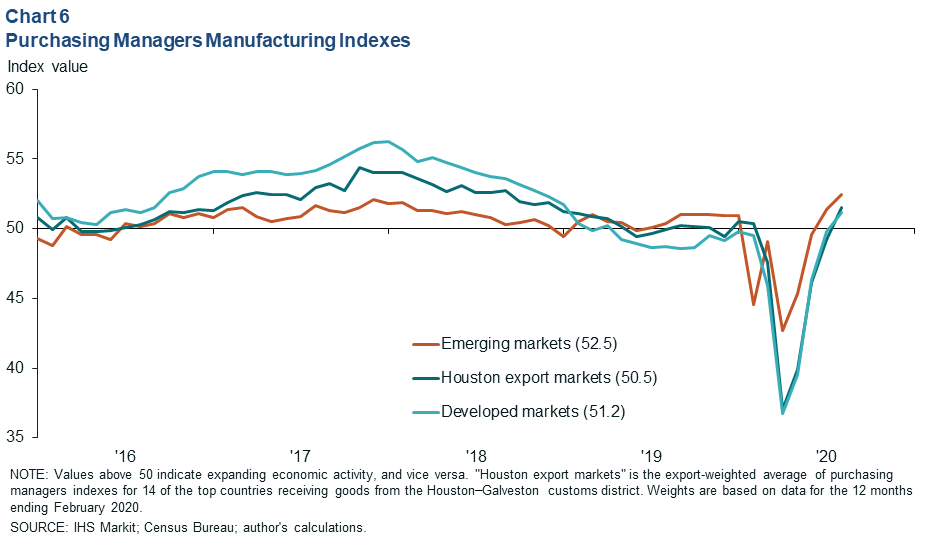
That improvement is consistent with the export-weighted global PMI for the Houston–Galveston customs district, which rose from a low of 37 in April to 50.5 in August. This implies that declines in manufacturing activity in Houston export markets have slowed but have not yet returned to aggregate growth.
NOTE: Data may not match previously published numbers due to revisions.
About Houston Economic Indicators
Questions can be addressed to Jesse Thompson at jesse.thompson@dal.frb.org. Houston Economic Indicators is posted on the second Monday after monthly Houston-area employment data are released.