Houston Economic Indicators

October 25, 2022
Houston payrolls continued to log significant gains through September, and high-frequency Houston data on trends in credit and debit card transactions as well as restaurant demand showed no sign of slowing by early October. However, leading economic indicators continue to signal slowing ahead. Taken together, recent data suggest that while Houston has a lot of momentum heading into winter, the local economy is likely to slow to a more sustainable pace of growth over the next several months.
Employment
Employment growth has been broad based and robust in 2022 (Chart 1). All Houston industries outside of those related to oil and gas and the tiny information sector (not depicted in the chart) have surpassed prepandemic levels of employment.
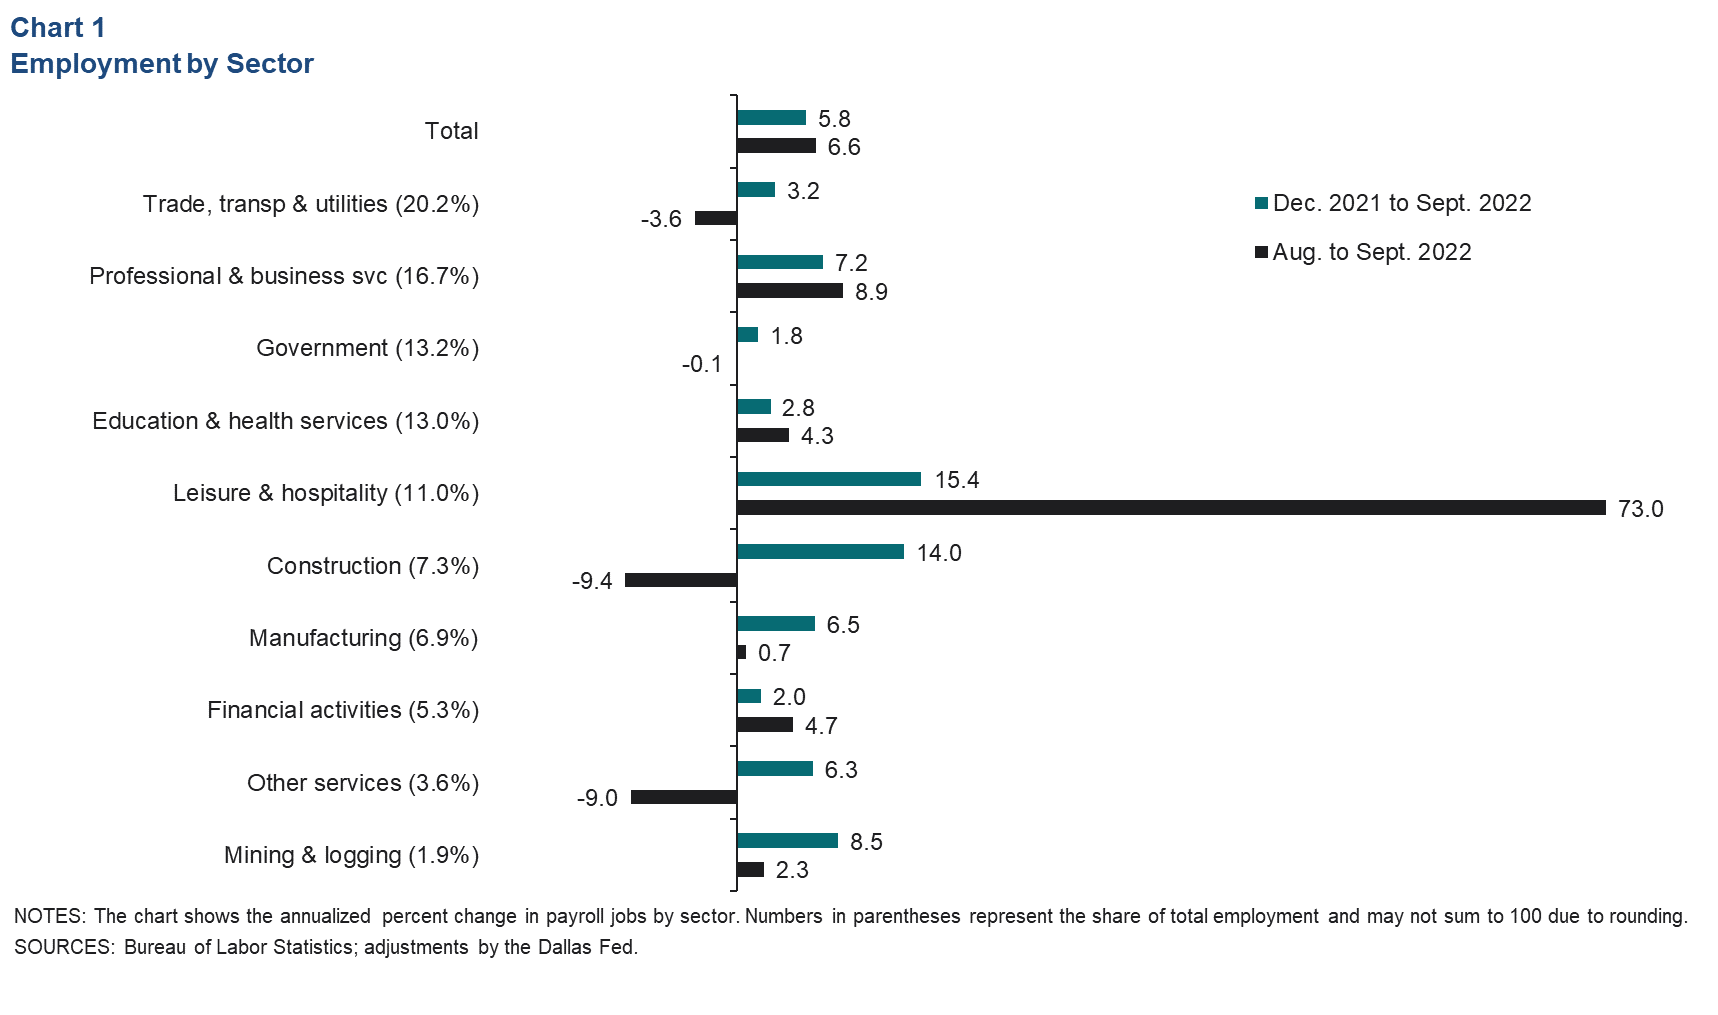
Payroll jobs have grown 5.8 percent this year through September. At that pace, the metro would add 183,600 jobs by year-end to reach 3.4 million. That would represent a full recovery to the number of jobs Houston would have reached had it stayed on its 2000‒19 pace of growth. Year to date, all industries have grown.
The one-month change in local payrolls accelerated to 6.6 percent, led by the leisure and hospitality sector and professional and business services. However, monthly jobs data are highly volatile at the local-industry level and subject to substantial revision. Of the four industry subsectors that lost jobs in September, only the large trade, transportation and utilities sector declined for two consecutive months.
Houston’s unemployment rate ticked down to 4.4 percent in September amid continued labor force growth. For comparison, the unemployment rate was 4.0 percent in Texas and 3.5 percent nationally.Consumer spending
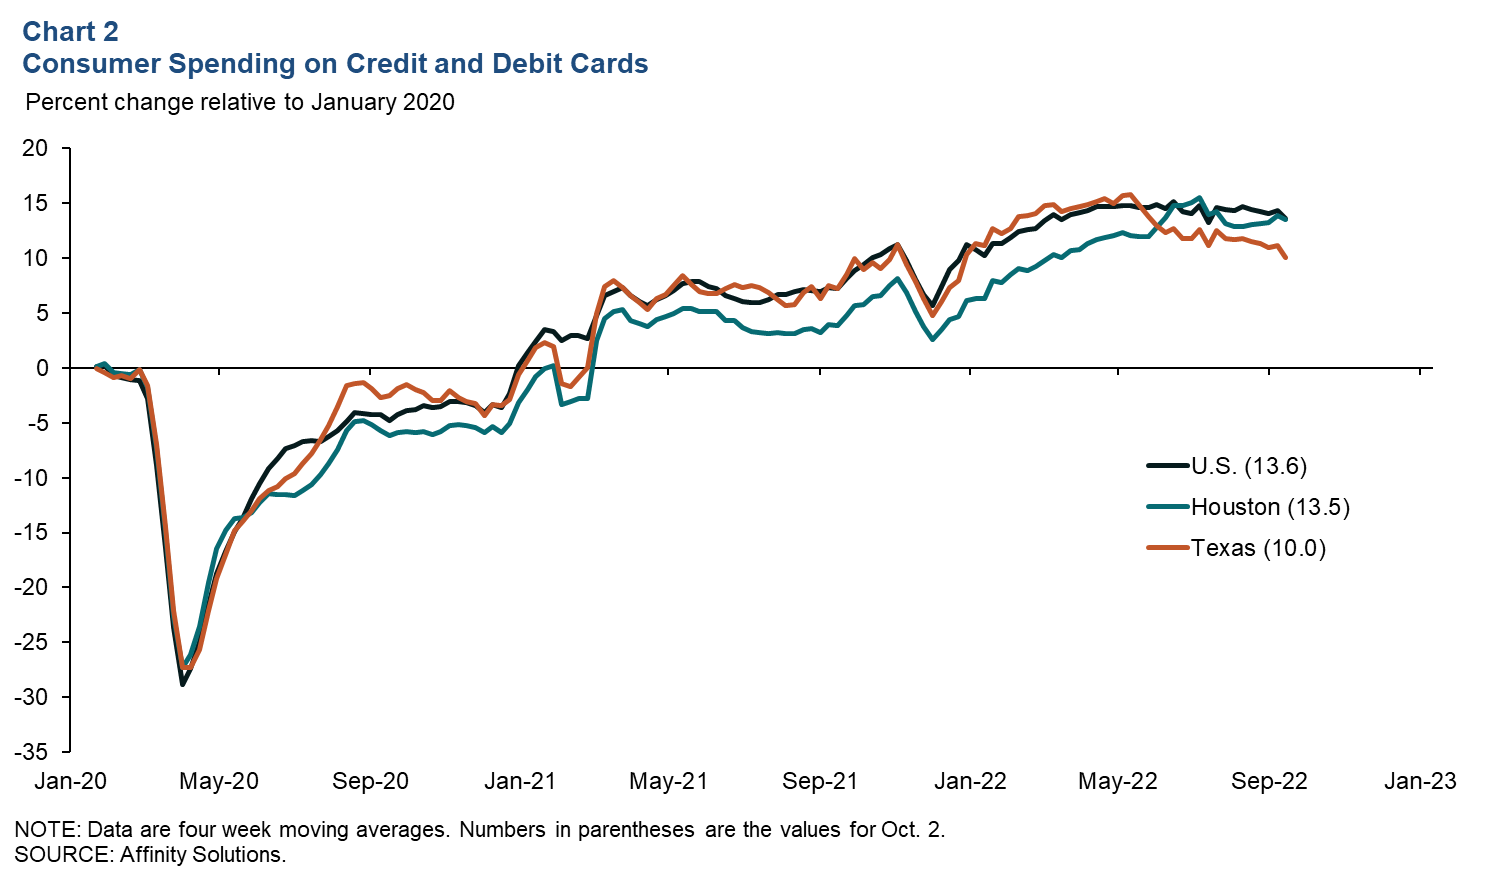
Nominal credit and debit card spending has picked up in Houston since April 2022, while spending nationally has leveled off (Chart 2). Compared with January 2020 levels, Houston card spending was up 13.5 percent over the four weeks ending the week of Oct. 2, 2022, and U.S. spending was up 13.6 percent. Texas spending stepped down over the summer to 10.0 percent, higher than in January 2020.
Restaurant demand
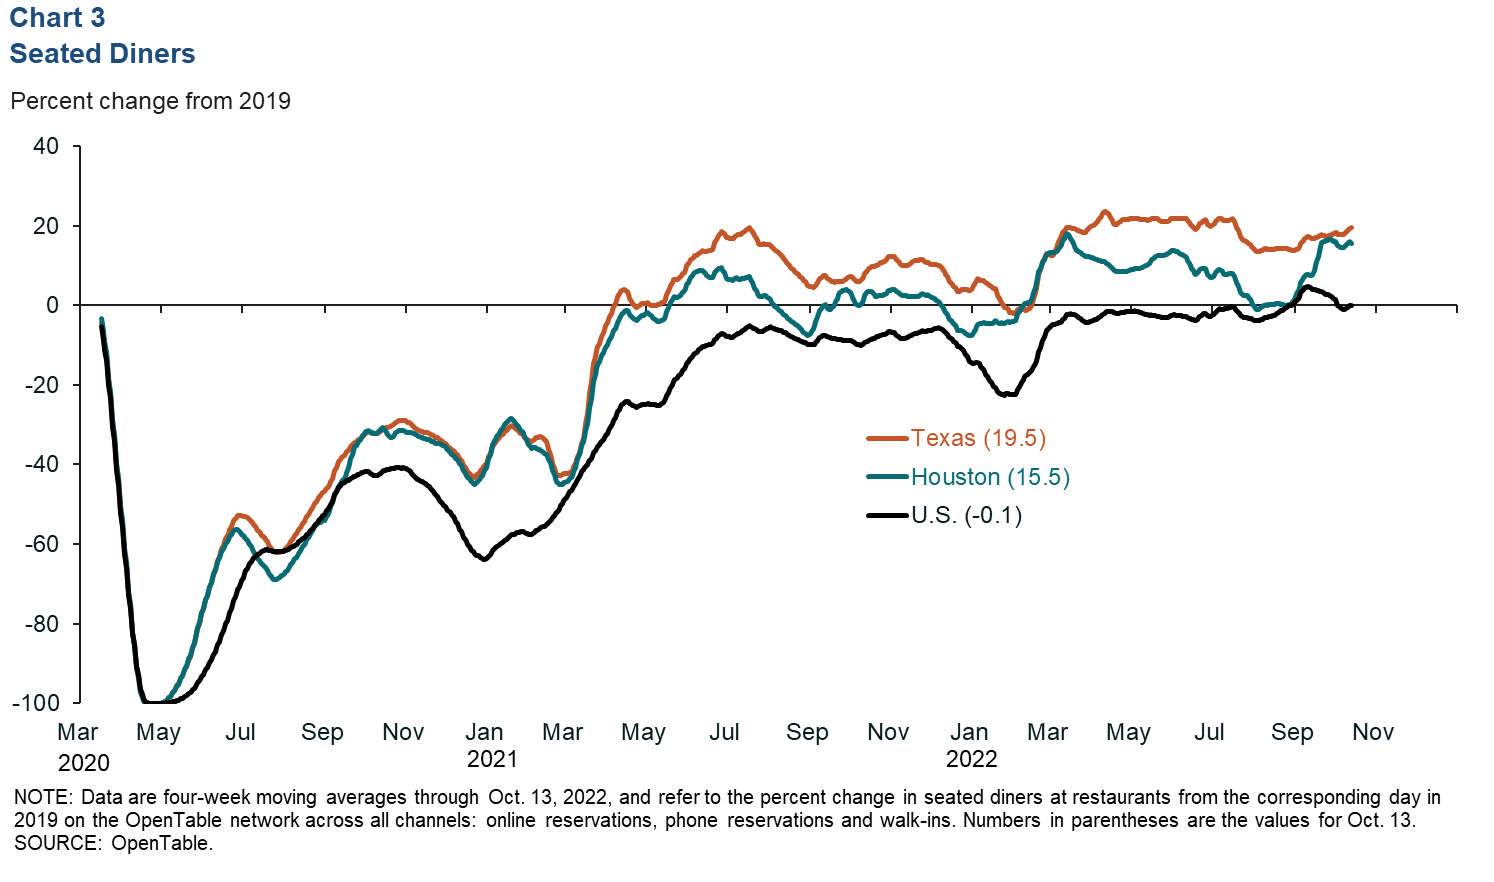
The number of diners seated in Houston restaurants recovered in September and October from summer lows (Chart 3). Dining demand stood 15.5 percent above the same period in 2019 over the four weeks ending Oct. 13. Texas demand was 19.5 percent higher than in 2019, while U.S. demand was flat.
Purchasing, leading indexes
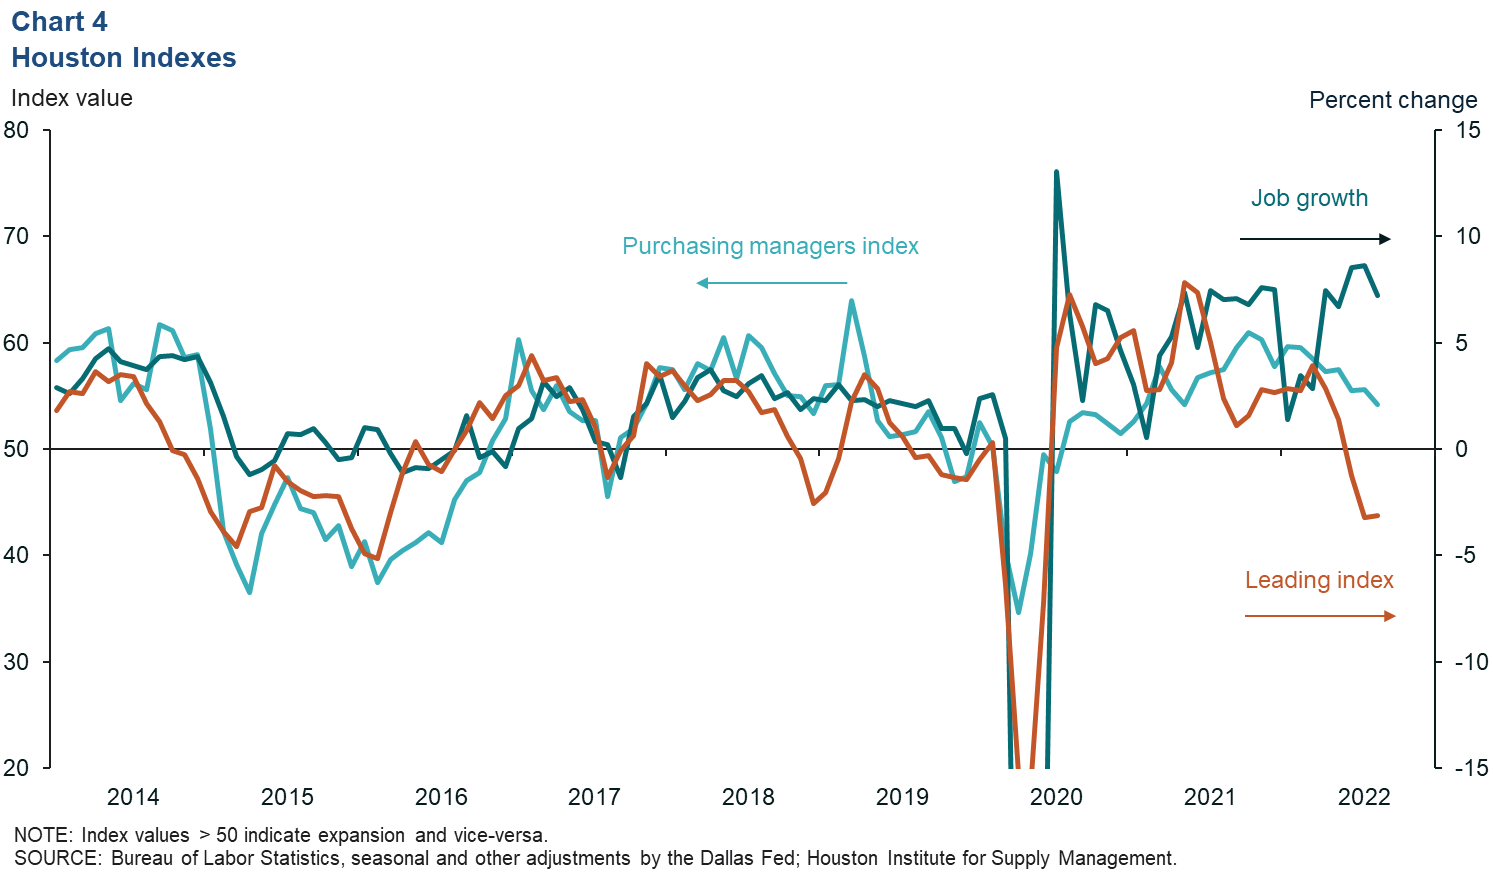
While Houston payrolls show little sign of slowing, coincident and leading indexes continue to weaken. The Houston Purchasing Managers Index dropped to 54.2 in August (Chart 4). While still indicative of growth, the index has trended down since October 2021 and is now at its lowest level since January 2021. The index’s key production component fell to 48.6, signaling that more producers reported a drop in output than an increase for the first time since May 2020. The leading index of Houston economic indicators dipped into negative territory, falling 3 percent over the three months ending in August. This implies substantially slower job growth over the next three to 12 months but not necessarily a decline in employment.
NOTE: Data may not match previously published numbers due to revisions.
About Houston Economic Indicators
Questions or suggestions can be addressed to Jesse Thompson at jesse.thompson@dal.frb.org. Houston Economic Indicators is posted on the second Monday after monthly Houston-area employment data are released.