Houston Economic Indicators

| Houston economy dashboard (February 2024) | |||||
| Job growth (annualized) Nov. '23–Feb. '24 |
Unemployment rate |
Avg. hourly earnings | Avg. hourly earnings growth y/y |
||
| 2.8% | 4.2% | $34.51 | 3.4% | ||
Houston’s job growth slowed over winter, decreasing from 3.3 percent year over year in November to 2.7 percent in February. However, local employment data were revised up, suggesting stronger growth in 2023 than previously reported. The Institute for Supply Management’s survey of Houston purchasing managers showed slowing growth. Commercial real estate data were mixed.
Employment
Job gains slow over winter
Houston employment grew an annualized 2.8 percent (or 23,732 jobs) from November 2023 through February 2024 (Chart 1). Information and other services grew at the fastest rate, rising 6.4 percent (2,534), while education and health services added the most jobs (6,932), driven mainly by health care and social assistance. Additionally, manufacturing saw strong job growth over the same period. Oil and gas was the only sector to post employment losses, dropping 8.3 percent (-1,506).
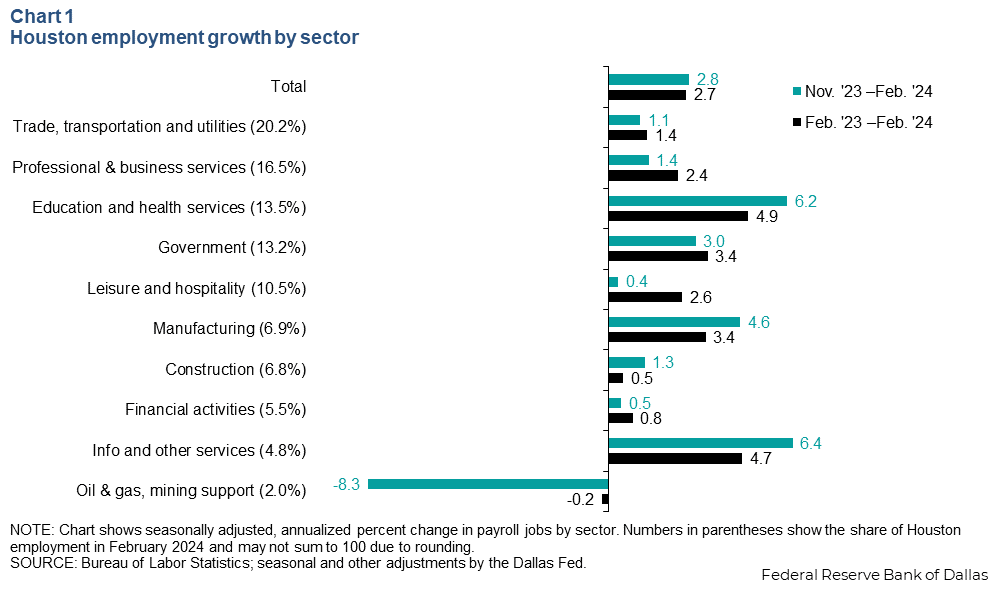
Almost all sectors saw strong growth in late 2023 and early 2024. Leisure and hospitality’s winter growth slowed markedly compared with its growth over the past year. With broad job growth across sectors, Houston’s labor market is still strong.
Job growth for 2023 revised up
Houston’s job growth in 2023 was stronger than initially estimated. The latest benchmark revision to employment data showed growth of 3.3 percent in fourth quarter 2023 compared with 0.8 percent in the initial estimate (Chart 2). This amounted to a net change of 21,177 jobs added in the metro in the fourth quarter, bringing the total number of fourth-quarter jobs added to 27,694.
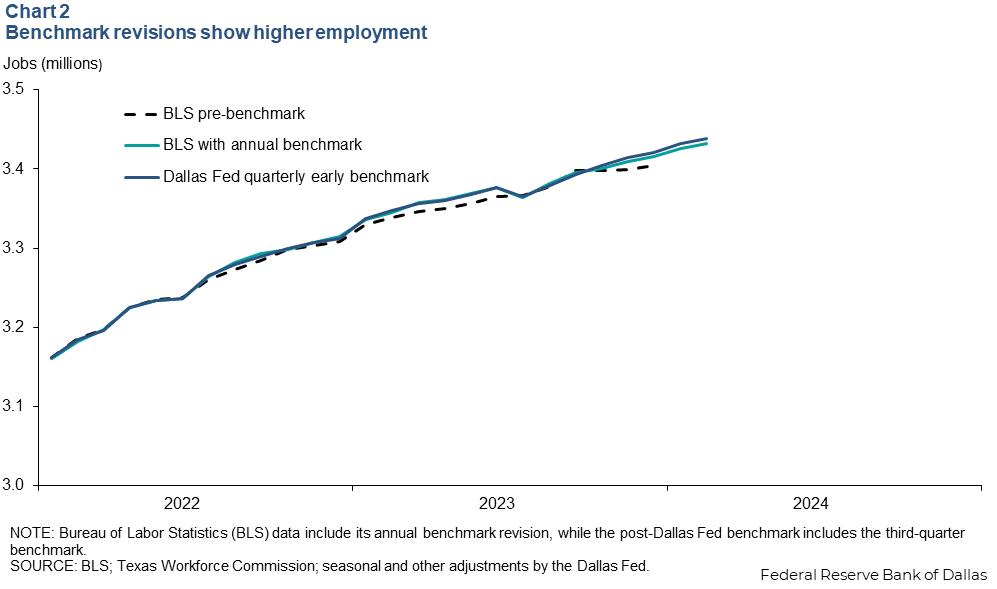
Overall, Houston added 108,440 jobs from December 2022 to December 2023 versus 95,347 jobs in the earlier estimate.
The Dallas Fed runs its quarterly early benchmark, and the Bureau of Labor Statistics (BLS) incorporates its annual employment benchmark to employment data to estimate jobs more accurately. Both procedures rely on the Quarterly Census of Employment and Wages, which covers about 97 percent of firms.
Production and leading indexes
The Houston Purchasing Managers Index (HPMI) cooled from 53.7 in February to 50.5 in March, as a smaller share of respondents reported expanding business conditions (Chart 3). Index values above 50 generally indicate growth in the regional economy, while those below 50 indicate contraction. The index hovered just above 50 throughout 2023, indicating mild expansionary activity—mainly driven by services.
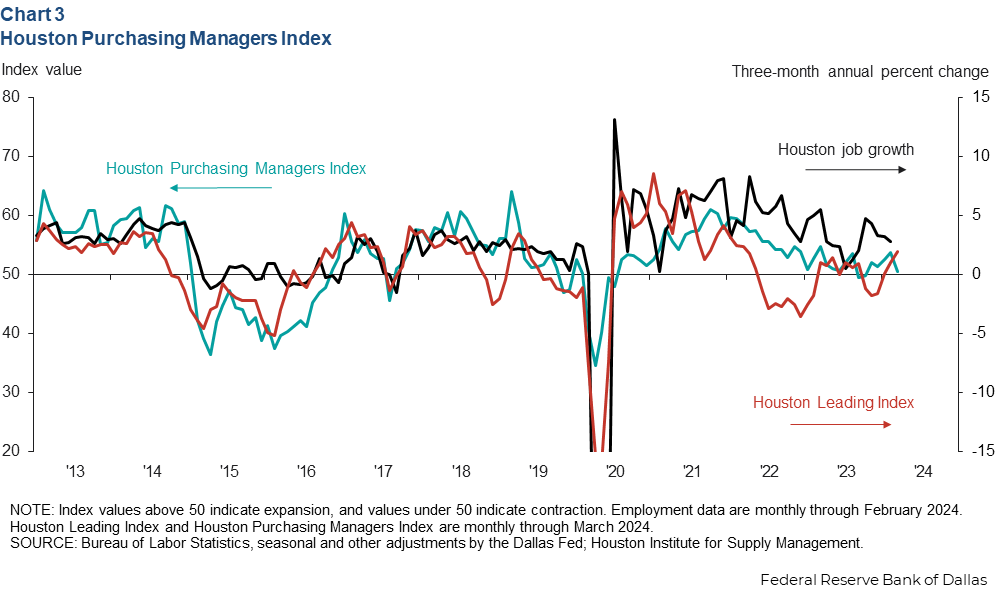
The implied weakness in March was broad based across HPMI components. Delivery lead times, purchased-goods inventories and finished-goods inventories signaled modest slowing of the local economy. The key sales (new orders) and production indexes also signaled a modest slowdown. Both are historically strongly correlated with job growth three months out. Employment and purchases indexes dropped the most; the former is strongly correlated with current job growth.
The Houston Leading Index (HLI) accelerated over the three months ending in March to 1.9 percent from -1.6 percent in the three months ending in December. The two leading components that contributed the most to acceleration were existing-home sales and Institute for Supply Management new orders. Nondurable manufacturing is driving the growth in new orders, which is reinforced by pickups in measures of U.S. petrochemical manufacturing activity.
Against the backdrop of such healthy job growth to start 2024, the readings from the HPMI and HLI imply that Houston’s economy, while apt to slow modestly toward its long-run trend over the coming year, will retain a substantial amount of momentum through the first half of 2024.
Commercial real estate
Asking rents for office space level off as vacancy rate ticks down
In fourth quarter 2023, the vacancy rate for office space in Houston ticked down to 23.8 percent (Chart 4). This is down from the peak of 26.2 percent in third quarter 2021. Houston’s office vacancy rate is higher than the U.S. average of 18.6 percent. Already distressed from overbuilding during the wake of the 2015–16 oil bust, the metro’s office market has followed national trends in remote work since the pandemic.
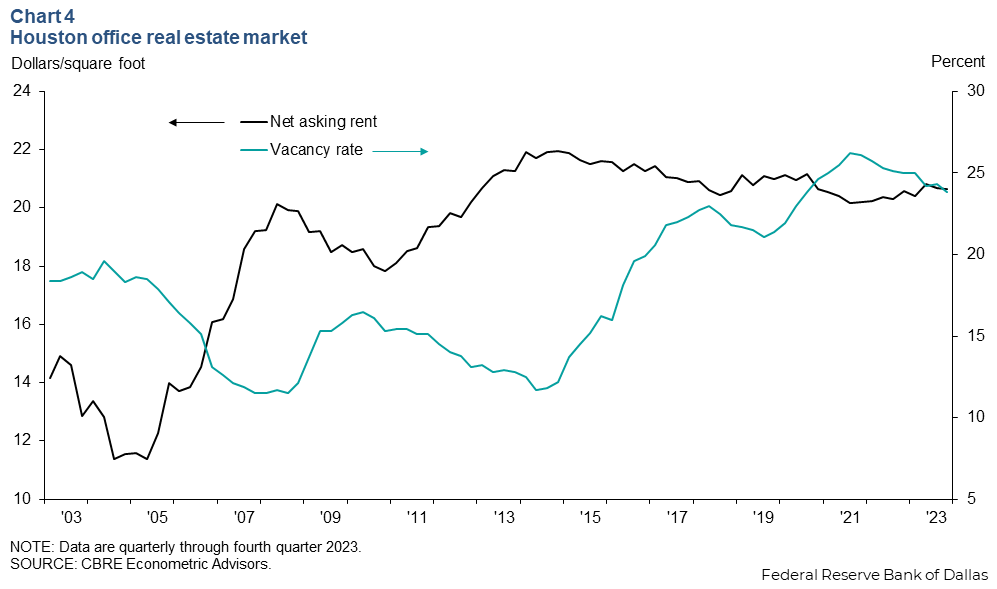
As landlords have struggled to fill their offices, nominal asking rents have remained nearly flat in Houston for 10 years. In fourth quarter 2023, average net asking rents were nearly $21 per square foot compared with fourth quarter 2014 when rents peaked at $22 per square foot—a net decline of 26.7 percent after adjusting for local inflation.
Industrial real estate cools from postpandemic boom
In fourth quarter 2023, Houston's industrial vacancy rate ticked up to 5.8 percent. Rents fell slightly to $8.97 per square foot (Chart 5).
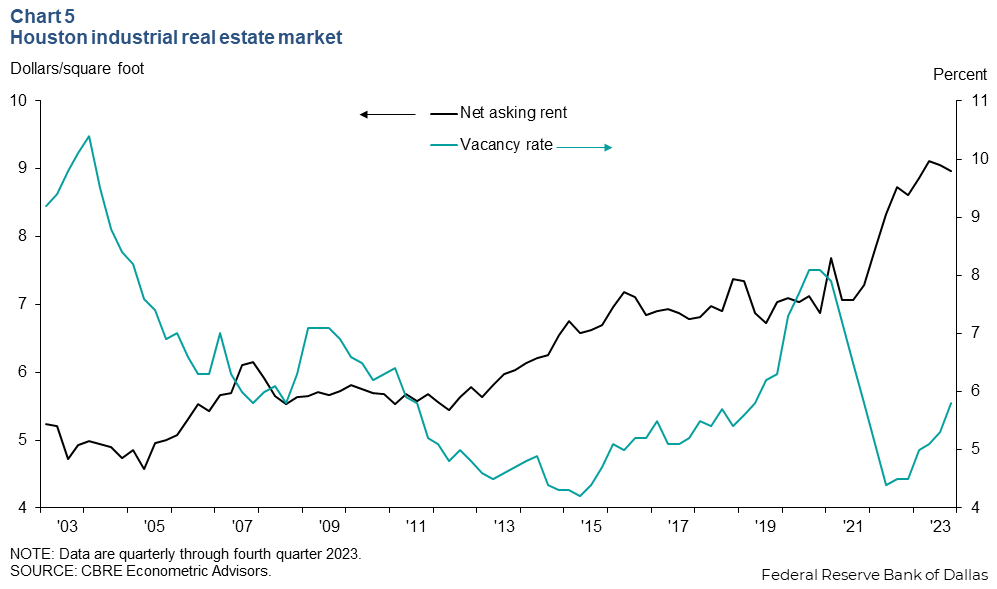
During Houston's pandemic recovery, the vacancy rate had fallen as low as 4.4 percent in second quarter 2022 as new construction could not keep pace with growing demand—particularly for warehousing. This precipitated a rise in rents, which reached a high of $9.11 in second quarter 2023. However, with slowing demand and the delivery of significant new supply, industrial vacancy rates have risen from their 2022 low. This contributed to a modest easing of rents in the second half of 2023.
Despite the uptick in vacancies in the last year, the industrial real estate market remains healthier than the office real estate market, which continues to suffer high vacancies and steady inflation-adjusted rent declines.
NOTE: Data may not match previously published numbers due to revisions.
About Houston Economic Indicators
Questions or suggestions can be addressed to Robert Leigh at robert.leigh@dal.frb.org. Houston Economic Indicators is posted on the second Monday after monthly Houston-area employment data are released.