Houston Economic Indicators

| Houston economy dashboard (April 2025) | |||||
| Job growth (annualized) Jan.–April '25 |
Unemployment rate |
Avg. hourly earnings | Avg. hourly earnings growth y/y |
||
| 0.9% | 4.4% | $35.62 | 2.5% | ||
Houston’s labor market expanded modestly in April, with employment increasing an annualized 0.9 percent over the last three months. Unemployment ticked up to 4.4 percent in April. Home price indexes fell in the first quarter, but apartment rent growth ticked down in April month over month. The inventory of new homes reached 5.0 months of supply in April—the highest reading since 2012. Permits for single-family homes ticked down, but multifamily permits rose.
Labor market
Houston payrolls expanded an annualized 0.9 percent over the past three months as anemic growth in February and March was offset by a strong one-month increase of 2.5 percent in April.
Growth was broadly strong across most sectors. Trade, transportation and utilities grew the fastest at 2.4 percent (4,234 jobs) over the three months ending in April (Chart 1). Education and health services was the second strongest sector, growing an annualized 1.9 percent (2,235).
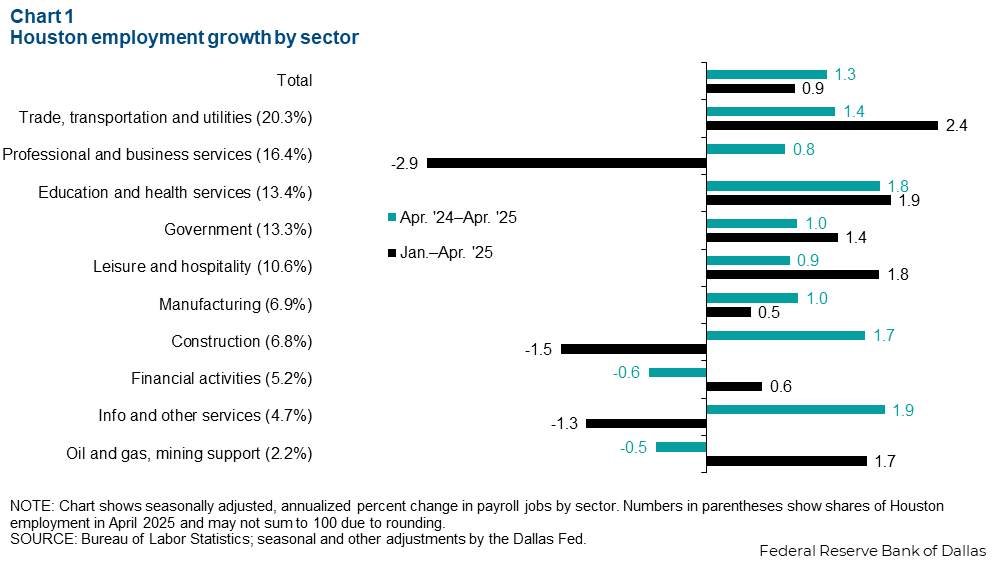
However, there was weakness in professional and business services, which declined an annualized 2.9 percent (-4,260) from January to April 2025. Construction payrolls fell an annualized 1.5 percent (-911). Professional and business services is a huge sector in Houston’s economy, and weakness in that sector was mostly driven by declines in legal services, computer systems design and services to the buildings and dwellings subsector.
Year over year, jobs grew 1.3 percent (43,346 jobs) in April 2025 compared with one year ago. Information and other services grew the fastest at 1.9 percent (3,019). In terms of number of jobs, trade, transportation and utilities expanded the most, adding 9,428 new jobs.
Consumer prices
Inflation as measured by growth in the consumer price index (CPI) ticked up in Houston over the first four months of 2025. After hitting a four-year low of 0.9 percent in January 2025, inflation ticked back up to 1.1 percent in April (Chart 2).
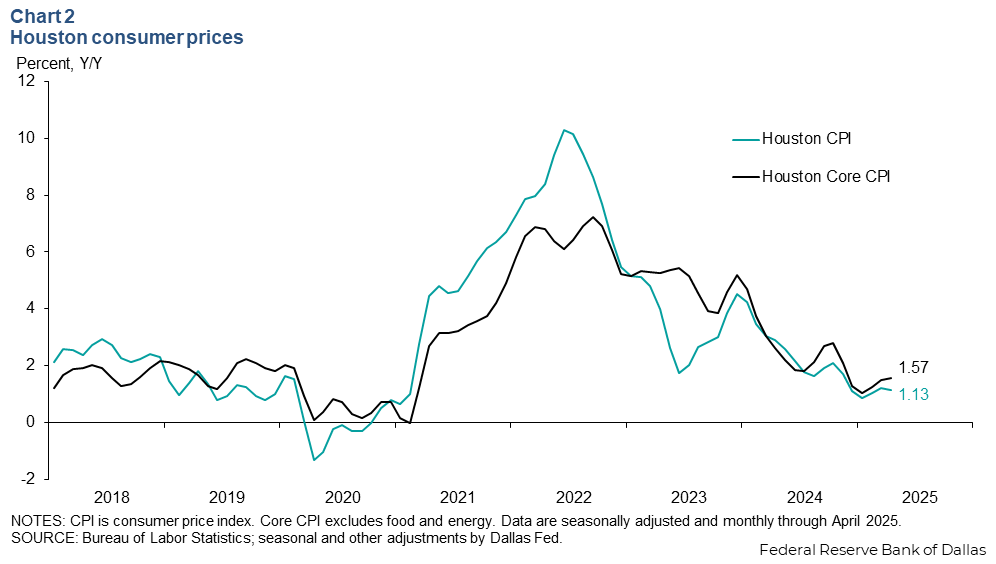
Similarly core inflation, which excludes the volatile food and energy categories, increased from 1.0 percent in January to 1.6 percent in April. For context, the annualized monthly CPI inflation rate prior to the pandemic (January 2018–December 2019) was 1.4 percent, while core inflation was 1.9 percent.
Residential real estate
House price growth moderates
Year-over-year growth in the Houston Federal Housing Finance Administration (FHFA) home-price index declined to 2.7 percent in the first quarter from 3.6 percent in the fourth quarter. The nominal median home sale price in Houston increased 2.2 percent year over year to $339,835 in March 2025 (Chart 3).
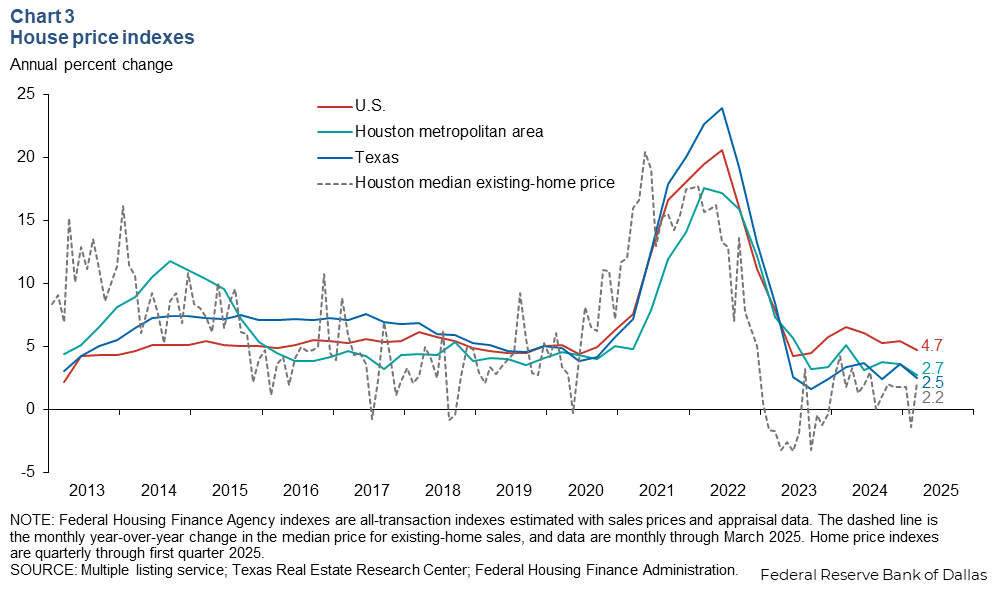
Houston’s home price growth was above the state’s 2.5 percent growth in the first quarter but below the nation’s 4.7 percent growth. Home prices typically appreciate more slowly in Texas than the nation due to the relative ease to bring new supply to market.
The FHFA price index is a repeat sales index that tracks the value of the same homes over time and gives a more accurate but less timely view than other measures of how much the average price of a home is changing. The index includes both sales and appraisals. In contrast, the median home selling price tracks whichever homes happen to have sold in a given month. It is more timely than FHFA data, but can be skewed by the changing composition of the homes selling at that time.
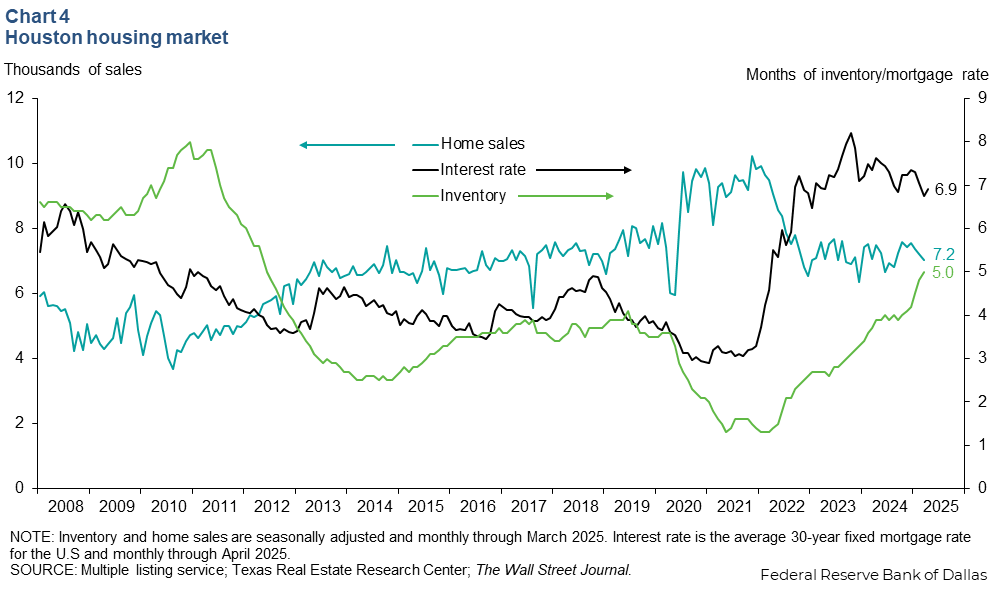
Inventory of homes hits highest level since 2012
Houston’s inventory of homes increased to 5.0 months of supply in March 2025 as more people listed their homes for sale (Chart 4). The level of inventory has risen markedly since December 2024, when the supply of homes in Houston was 4.2 months. Existing-home sales slowed to 7,038 in March from 7,564 in December but remained well within levels seen the past three years.
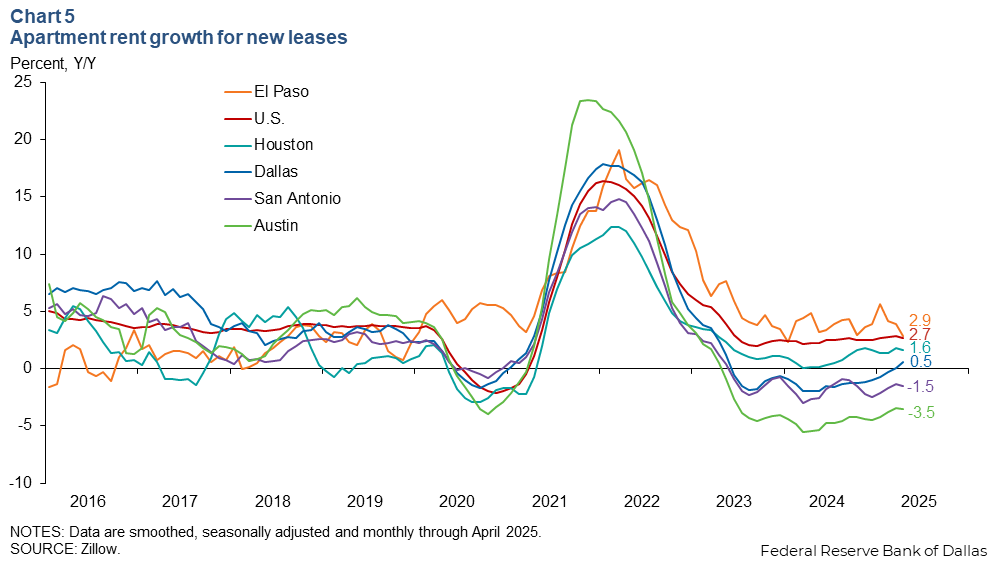
Apartment rent growth steady in Houston
Nominal apartment rents for new leases measured by the Zillow Observed Rent Index grew 1.6 percent year over year in April (Chart 5). Rent growth over the past year has increased significantly. In April 2024, apartment rents in Houston grew just 0.2 percent annually.
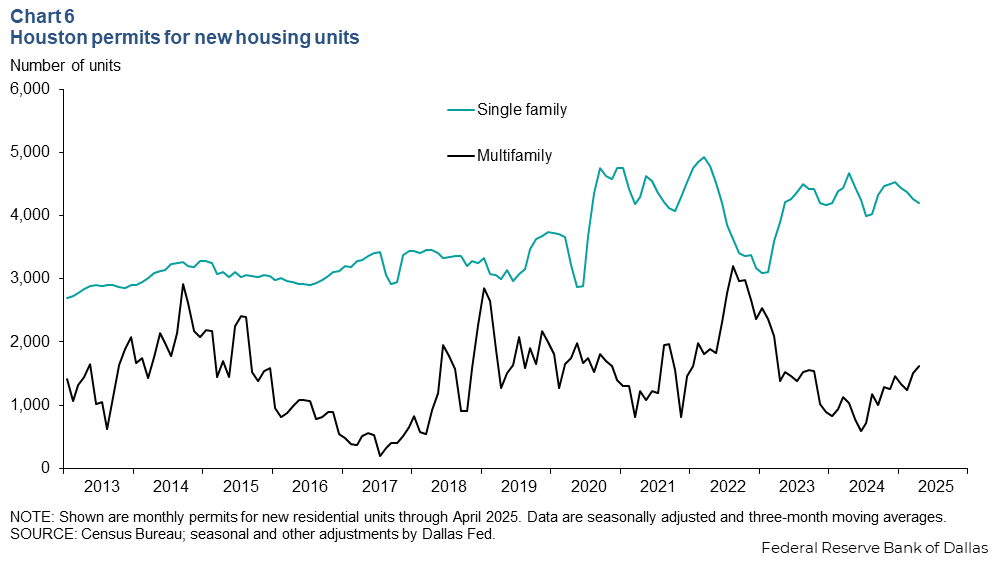
Single-family home building cools
The three-month moving average of building permits for single-family homes in the Houston metro area fell to 4,198 in April 2025 from a recent high of 4,533 in December 2024 . Year over year, single-family permits fell 10.1 percent from April 2024.
However, permits for multifamily units increased to 1,623 in April 2025 from 1,464 in December 2024 (Chart 6). Year over year, multifamily permits grew 57.7 percent, the fastest pace since January.
NOTE: Data may not match previously published numbers due to revisions.
About Houston Economic Indicators
Questions or suggestions can be addressed to Robert Leigh at robert.leigh@dal.frb.org. Houston Economic Indicators is posted on the second Monday after monthly Houston-area employment data are released.