Houston Economic Indicators

| Houston economy dashboard (June 2025) | |||||
| Job growth (annualized) March–June '25 |
Unemployment rate |
Avg. hourly earnings | Avg. hourly earnings growth y/y |
||
| 0.1% | 4.1% | $36.06 | 3.7% | ||
Houston payrolls were nearly flat over the three months ending in June 2025. However, the unemployment rate fell from 4.4 percent in May to 4.1 percent in June. Oil production rebounded in April, but declining drilling activity in June foreshadowed a slowdown in future crude production. Local drivers saw stable prices for retail gasoline in the second quarter. Trade activity by volume declined in Houston in May. By dollar value, oil and gas exports ticked down notably in May.
Labor market
Houston’s labor market grew an annualized 0.1 percent over the three months ending in June, essentially flat (Chart 1). Professional and business services saw a notable 4 percent annualized decline in employment (-5,752 jobs). This contraction in Houston’s second largest sector was partially offset by healthy growth in education and health services, which expanded an annualized 4.3 percent (4,873). The metro area’s largest employment sector, trade, transportation and utilities, grew a slight 0.6 percent annualized (997). Oil and gas and mining support jobs grew a substantial 9.3 percent (1,691). While the growth rate is large, the sector is small in Houston and subject to substantial revision.
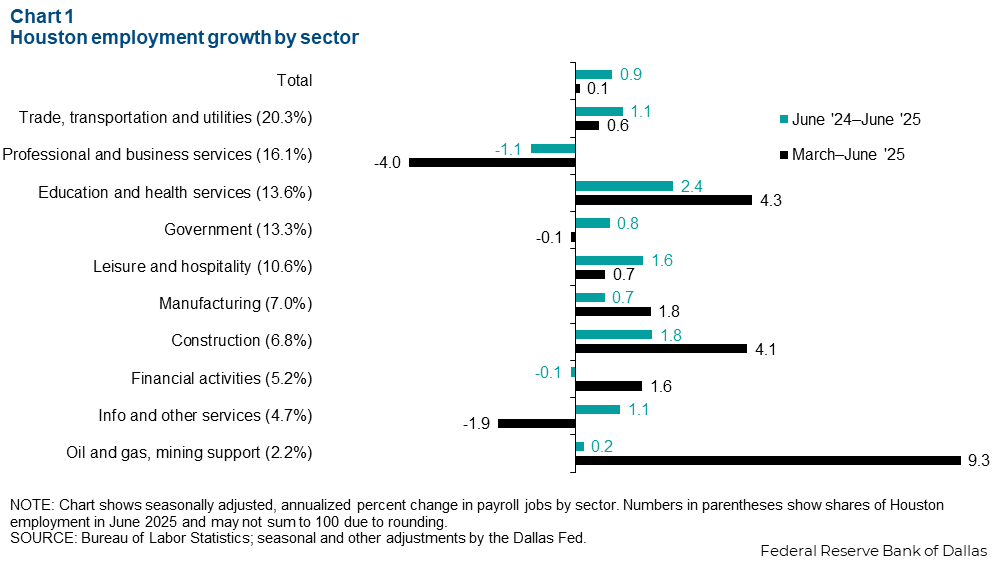
Over the year ending in June 2025, Houston added jobs at a below-average pace, growing 0.9 percent (30,516). Payrolls expanded modestly across most sectors. Growth was strongest in education and health services, which expanded 2.4 percent (10,815). However, professional and business services contracted 1.1 percent (-6,129) while financial activities and oil and gas were both essentially flat.
Energy
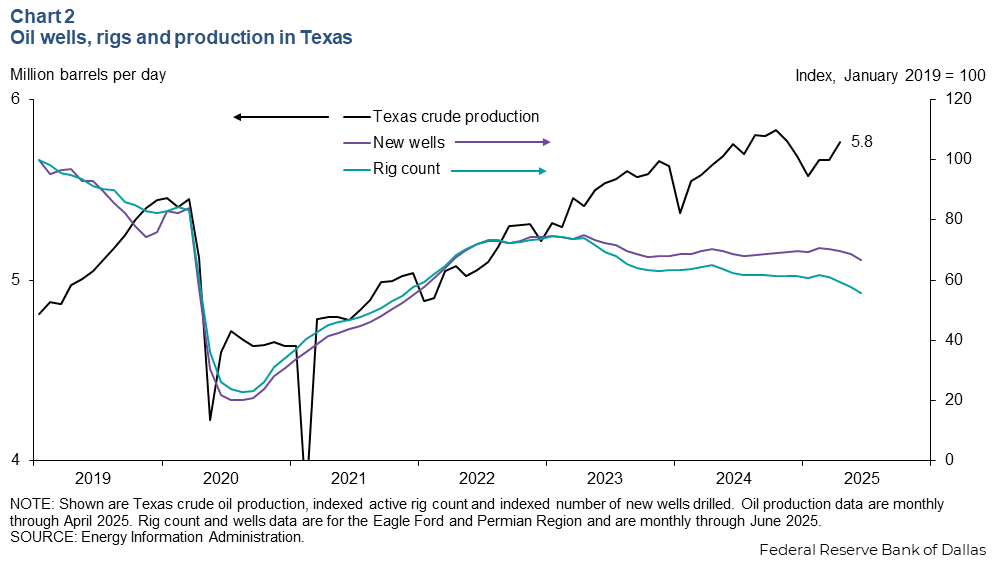
Oil production rebounds but drilling activity declines
Crude oil production in Texas has risen from a low this year of 5.6 million barrels per day (mb/d) in January to 5.8 million mb/d in April (Chart 2). Little of this production takes place in the Houston metro area, but the region is home to a multitude of energy industry corporate headquarters. At the same time production rose, the number of active drilling rigs in the Eagle Ford and Permian regions fell to 322 in June from 354 in March. Over the same period, the number of new wells drilled in those regions declined to 544 in June from 574 in March. Improving efficiency over the past several years has kept the number of wells drilled per month relatively steady, despite the declines in drilling activity as the industry does more with less. Chart 2 shows these figures as indexed values.
Gasoline and crude prices stable while diesel ticks up
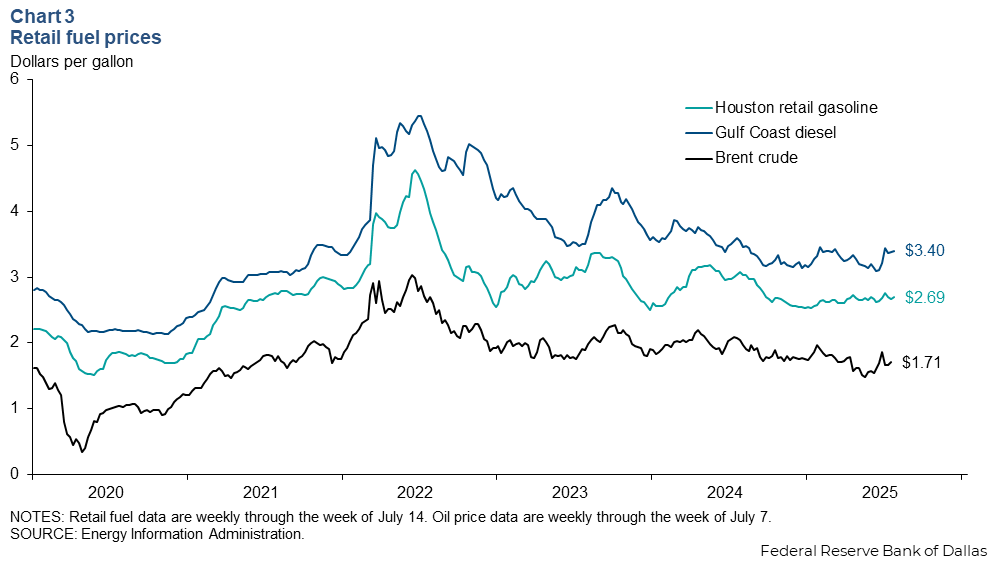
Brent crude spot prices were $1.71 per gallon the week ending July 7. Compared to prices at the end of the first quarter, this is nearly unchanged from $1.78 per gallon the week ending March 31 (Chart 3). Similarly, retail gasolines prices in Houston changed little over the second quarter. Houstonians paid $2.69 per gallon at the pump the week ending July 14, up very slightly from $2.68 per gallon the week ending March 31. Diesel prices saw more growth. The retail price of Gulf Coast diesel rose from $3.28 per gallon the week ending March 31 to $3.40 the week ending July 14.
Trade
Trade activity by volume contracts
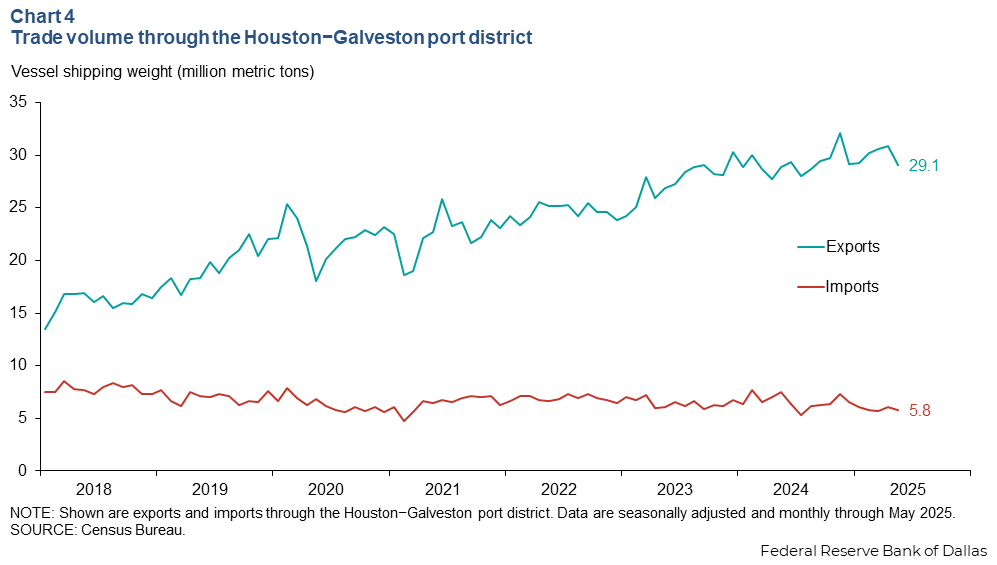
The volume of exports through the Houston–Galveston port district fell to 29.1 million metric tons (mmt) in May 2025 from 30.8 mmt in April (Chart 4). Year to date, export volumes fell 0.13 percent.
Import volumes declined from 6.1 mmt in April to 5.8 mmt in May. Year to date, import volumes fell 11.6 percent.
Real value of oil and gas exports fall notably
The real dollar value of oil and gas exports through the Houston–Galveston port district fell to $9.2 billion in May 2025 from $9.5 billion in April (Chart 5). Year to date, oil and gas export values fell 9.3 percent.
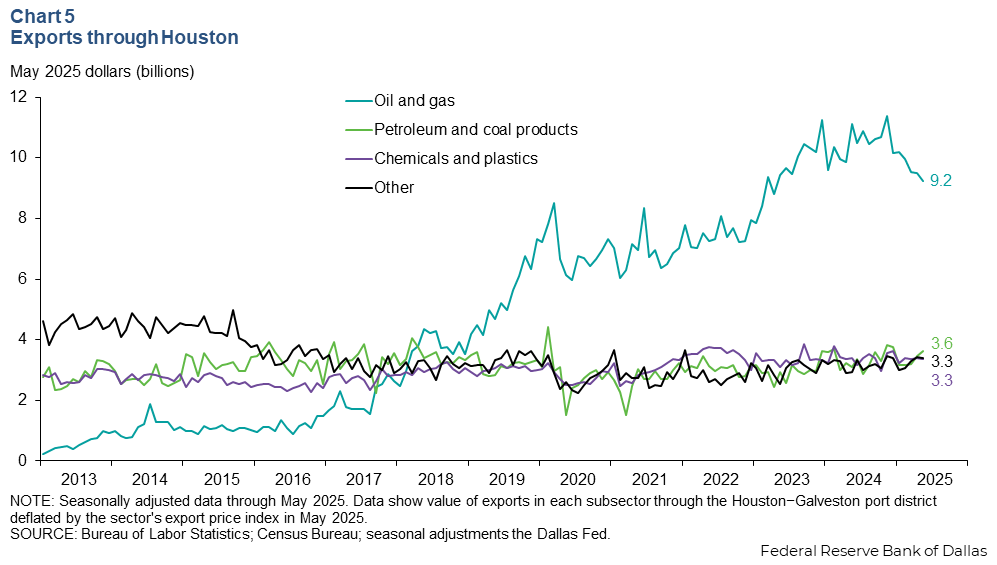
Although deflated values are declining, monthly barrels of crude for export have been flat and exports of liquified natural gas have increased. The average price of West Texas intermediate crude declined from $67.27 per barrel the week ending March 7 to a low of $59.04 the week ending May 9. Prices rebounded in June, but export data are not yet available.
Export values in other energy-related categories were more stable. Petroleum and coal product exports ticked up from $3.5 billion to $3.6 billion from April to May and grew 14.6 percent year-to-date compared to 2025. Chemicals and plastics export values fell from $3.4 billion in April to $3.3 billion in May. Year-to-date real chemicals and plastics export values were up 3.4 percent.
NOTE: Data may not match previously published numbers due to revisions.
About Houston Economic Indicators
Questions or suggestions can be addressed to Robert Leigh at robert.leigh@dal.frb.org. Houston Economic Indicators is posted on the second Monday after monthly Houston-area employment data are released.