Houston Economic Indicators

| Houston economy dashboard (August 2025) | |||||
| Job growth (annualized) April–July '25 |
Unemployment rate |
Avg. hourly earnings | Avg. hourly earnings growth y/y |
||
| -0.9% | 4.2% | $35.77 | 0.5% | ||
Houston’s economy weakened as employment in the metro area declined an annualized 0.9 percent over the three months ending in July. However, unemployment ticked down slightly as both the size of the labor force and the number of unemployed people declined. The Dallas Fed’s early benchmarking of payroll employment data showed the metro area’s year-to-date growth was slower than initially estimated. The Houston Purchasing Manager’s Index and Houston Leading Index turned positive, indicating some improvement in economic conditions. Indexes of input prices show increasing costs of goods for manufacturing.
Labor market
Job growth mixed across sectors
Houston’s labor market contracted 0.9 percent over the three months ending in July 2025 (-8,022 jobs) (Chart 1). Construction grew the fastest at 6.5 percent (3,895 jobs) from April 2025 through July 2025. Over the same time, education and health grew a robust 3.9 percent (4,463). Information and other services and oil and gas also posted decent growth, but these sectors are smaller portions of the local economy.
Job gains in these sectors were eclipsed by declines in government, professional and business services, and manufacturing. Government contracted an annualized 8.8 percent (-10,519) mostly driven by local government employment. Professional and business services declined 3.7 percent annualized (-5,233). The manufacturing sector declined an annualized 2.3 percent (-1,426) while financial services and trade, transportation and utilities were flat.
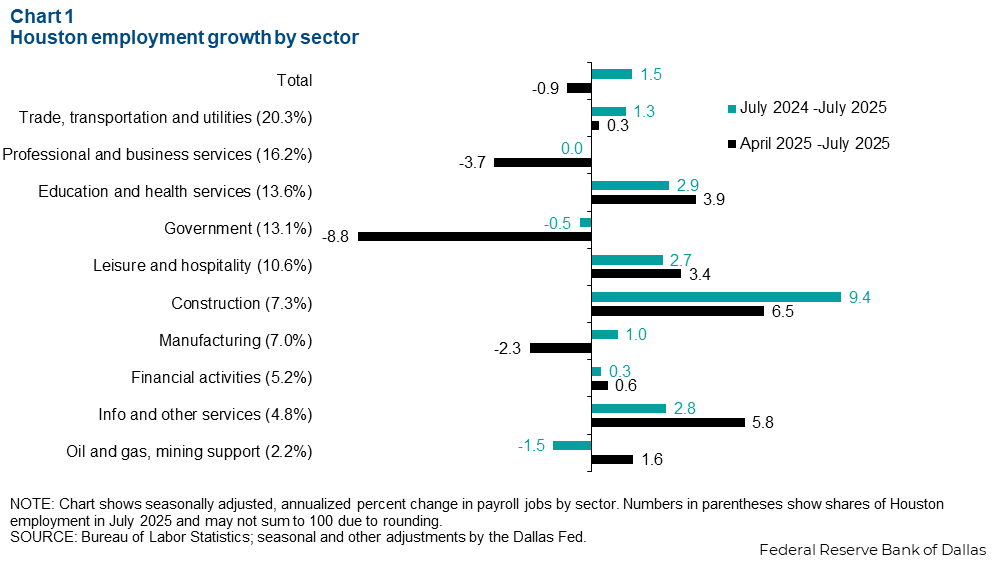
Year over year, jobs grew 1.5 percent (51,704 jobs) in July 2025 compared to one year ago. This seemingly strong growth is mostly due to base effects from Hurricane Beryl in July 2024. A better measure of long-run growth in this case is year-to-date employment growth. From December 2024 through July 2025, total nonfarm employment in Houston was nearly flat, declining 0.2 percent (-8,022).
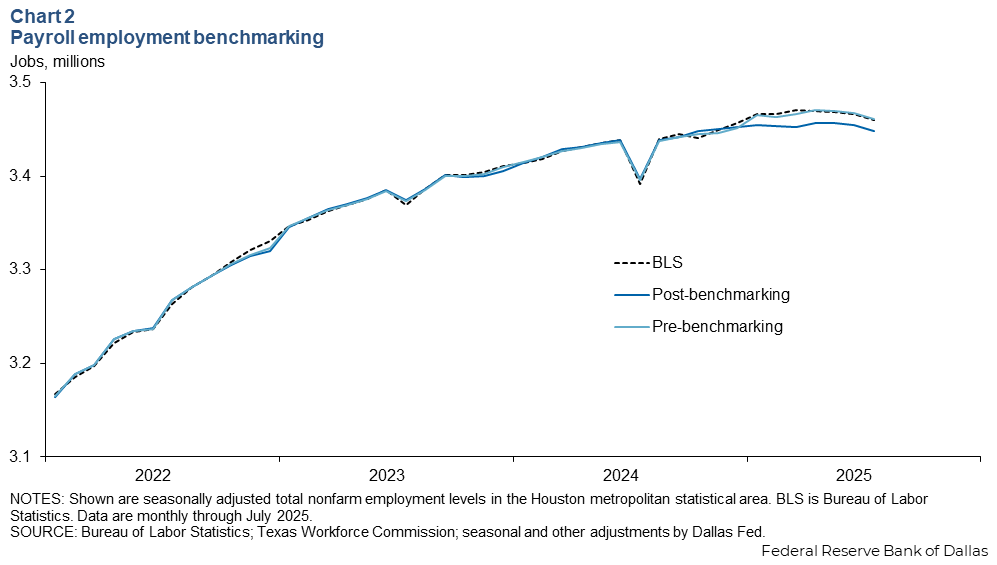
Early benchmark revisions push down Houston’s employment
Houston’s job growth year to date in 2025 was weaker than initially estimated. While the Bureau of Labor Statistics (BLS) benchmarks its data annually with the release of January employment data, the Dallas Fed benchmarks employment data early, with quarterly releases. The Dallas Fed’s latest revision to employment data using the first-quarter Quarterly Census of Employment and Wages erased 14,900 jobs from Houston payrolls (Chart 2). This translates to a year-to-date contraction of 0.2 percent July 2025 compared to an initially estimated 0.5 percent growth rate. The BLS currently estimates year-to-date growth in the Houton metro at 0.15 percent. Prior to the early benchmark, Dallas Fed employment data were closely tracking the BLS series.
Purchasing Managers Index
Purchasing Managers, Houston Leading indexes tick down
The Houston Purchasing Manager’s Index (HPMI) increased to 52.3 in July 2025 from 50.6 in June, as a larger share of respondents reported expanding economic conditions (Chart 3). Index values above 50 generally indicate growth in the regional economy while those below 50 indicate contraction. The index dipped to a recent low of 48.2 in April 2025.
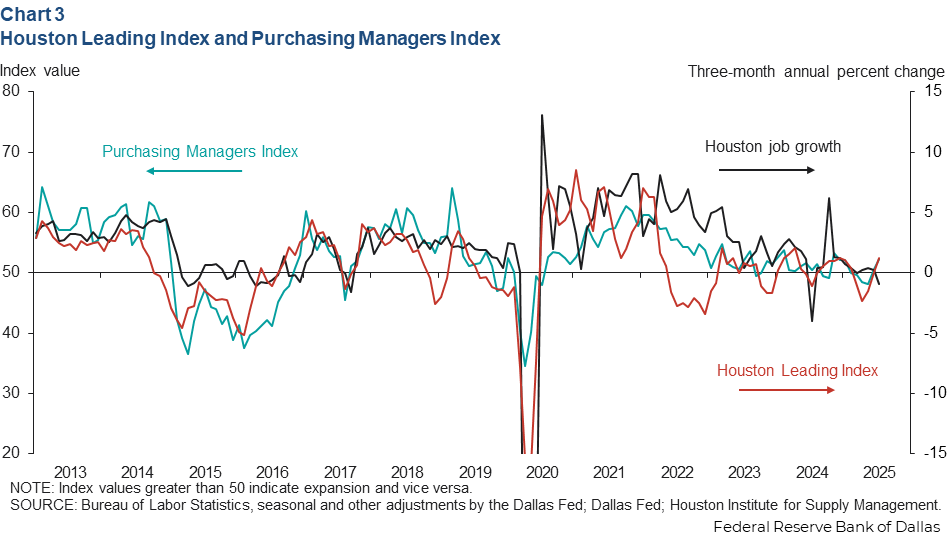
The subcomponents of the HPMI showed robust growth in sales, and production growth also ticked up. However, input prices continued to rise, and employment contracted.
The Houston Leading Index (HLI) turned positive and accelerated over the three months ending in July to 1.2 percent from -2.3 percent in the three months ending in April. The Houston 150 stock index, oil prices and chemical railcar loadings contributed most to the uptick, flipping from significant headwinds to modest tailwinds.
Taken together, expansions in the HPMI and HLI indicate that over the next three to nine months local job growth will improve from the recent slump but remain below trend. The current labor market contraction was foreshadowed by the HLI and HPMI turning negative in the second quarter of this year.
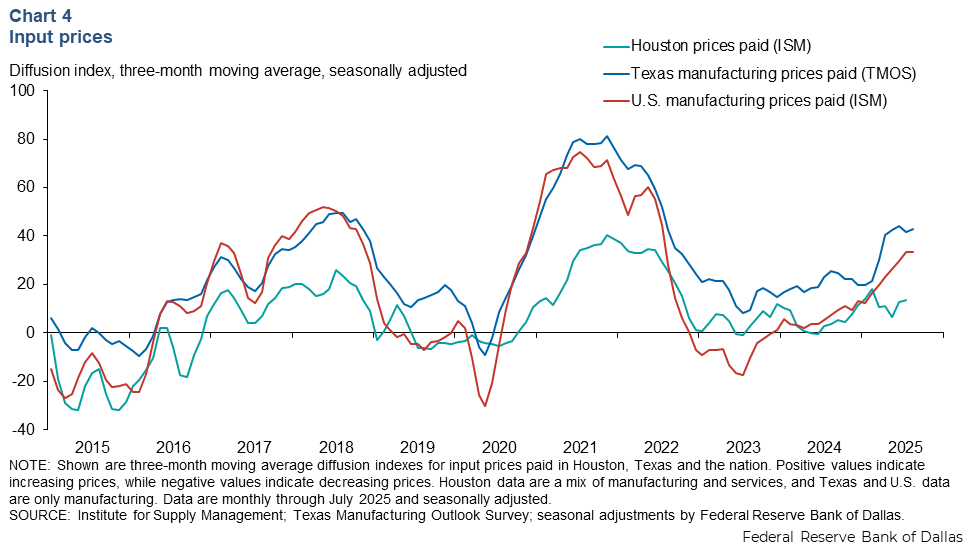
Purchasing manager surveys show input prices trending up
The three-month moving average diffusion index for input prices paid in Houston accelerated from 10.9 in April 2025 to 13.7 in July 2025 (Chart 4). Smoothed diffusion indexes for input prices in Texas and the U.S. similarly increased. The national manufacturing prices paid index increased from 23.1 in April 2025 to 33.5 in August 2025. The Texas Manufacturing Outlook Survey prices paid index increased from 40.4 in April 2025 to 42.8 in August 2025.
NOTE: Data may not match previously published numbers due to revisions.
About Houston Economic Indicators
Questions or suggestions can be addressed to Robert Leigh at robert.leigh@dal.frb.org. Houston Economic Indicators is posted on the second Monday after monthly Houston-area employment data are released.