Houston Economic Indicators

| Houston economy dashboard (August 2025) | |||||
| Job growth (annualized) May–Aug. '25 |
Unemployment rate |
Avg. hourly earnings | Avg. hourly earnings growth y/y |
||
| 0.1% | 4.6% | $36.09 | 3.2% | ||
Houston’s labor market saw no notable growth over the three months ending in August, with employment increasing an annualized 0.1 percent. Unemployment ticked up to 4.6 percent in August. Consumer price inflation decreased. Home price indexes fell in the second quarter, and apartment rents were unchanged year over year. The inventory of new homes reached 5.2 months of supply in July, the highest reading since 2012. Permits for single-family homes and apartments ticked down.
Labor market
Houston payrolls were flat over the three months ending in August, expanding an annualized 0.1 percent (717 jobs) (Chart 1).
Growth was mostly anemic, with a few sectors showing strength. Construction grew the fastest at 6.7 percent (4,047 jobs) from May through August driven by construction of buildings and heavy and civil engineering construction. Education and health services employment expanded 5.2 percent (5,888). However, there was weakness in professional and business services, which declined an annualized 4.0 percent (-5,275). Manufacturing payrolls fell an annualized 3.4 percent (-2,068). Financial activities and oil and gas and mining support also contracted. Trade, transportation and utilities, Houston’s largest employment sector, was flat over the past three months.
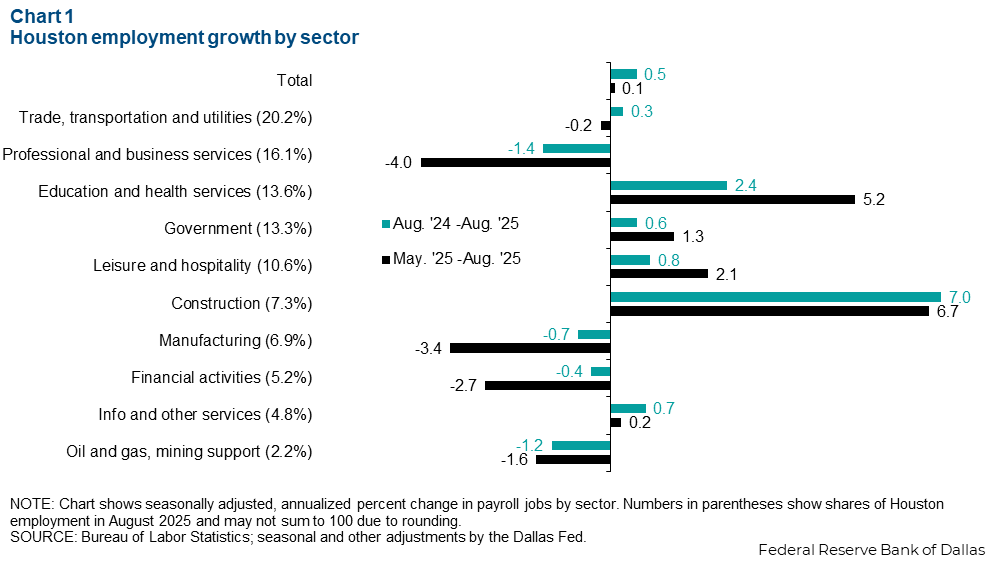
Year over year, jobs grew just 0.5 percent (18,672 jobs) in August 2025 compared with one year ago—well below the metro area’s historical average growth rate. Year-over-year growth was similarly mixed in various sectors. Construction grew the fastest, expanding 7.0 percent (16,357) from August 2024 to August 2025. Education and health services payrolls expanded 2.4 percent (11,272) year over year. The largest contraction was in professional and business services, which declined 1.4 percent (-8,103) year over year. Professional and business services declines were driven by the computer systems design and administrative services subsectors. Legal, accounting and architectural and engineering services maintained modest growth over the past year.
Consumer prices
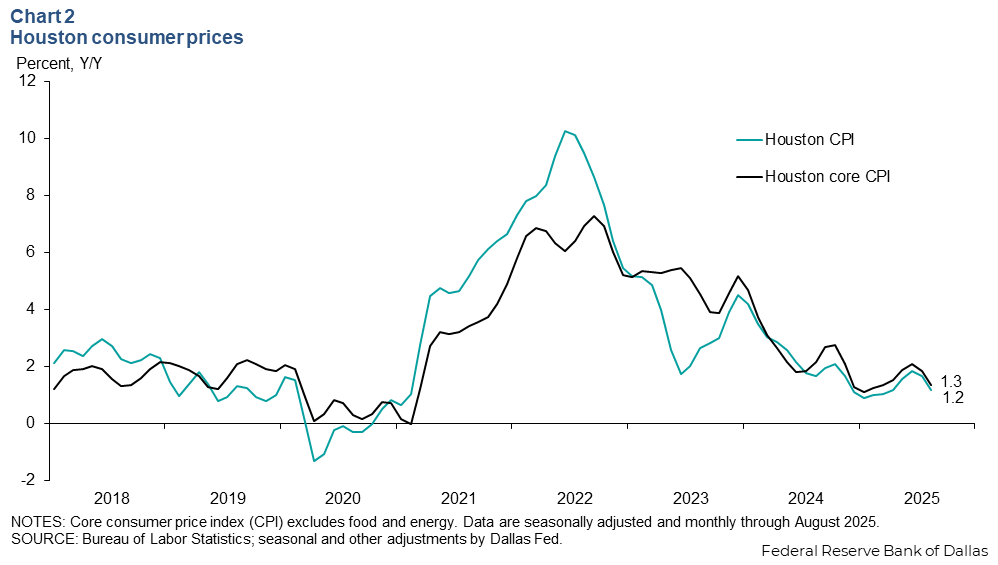
Inflation as measured by growth in the consumer price index (CPI) ticked down in Houston (Chart 2). After hitting a high this year of 1.8 percent in June, year-over-year inflation ticked back down to 1.2 percent in August.
Similarly core inflation, which excludes the volatile food and energy categories, decreased from 2.1 percent in June to 1.3 percent in August. For context, the compound annualized monthly CPI inflation rate from 2018–2019 was 1.4 percent. Average annualized monthly core inflation over that time was 1.9 percent.
Residential real estate
House price growth moderates
Year-over-year growth in the Houston Federal Housing Finance Administration (FHFA) home-price index declined to 2.3 percent in the second quarter from 2.9 percent in the first quarter (Chart 3). The nominal median home sale price in Houston decreased 2.7 percent year over year to $330,972 in July 2025.
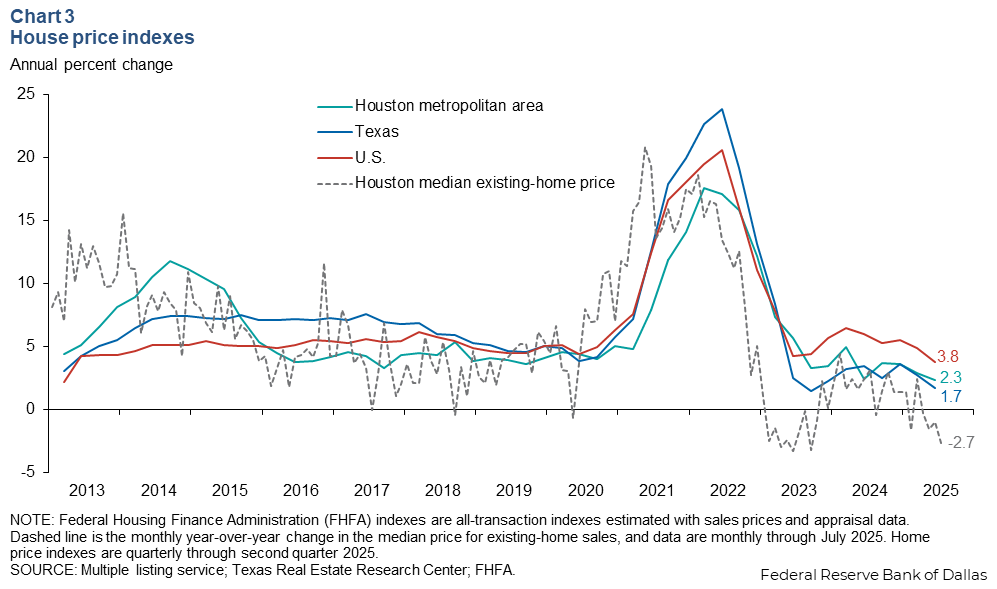
Houston’s home price growth was above the state’s 1.7 percent growth in the first quarter and the nation’s 3.8 percent growth. Home prices typically appreciate more slowly in Texas than the nation due to the relative ease of bringing new supply to market.
The FHFA price index is a repeat sales index that tracks the value of the same homes over time and gives a more accurate but less timely view than the multiple listing service data of how much the average price of a home is changing. The index includes both sales and appraisals. In contrast, the median home selling price tracks whichever homes happen to have sold in a given month. It is more timely but can be skewed based on the changing composition of the homes selling at that time.
Inventory of homes holds at highest level since 2012
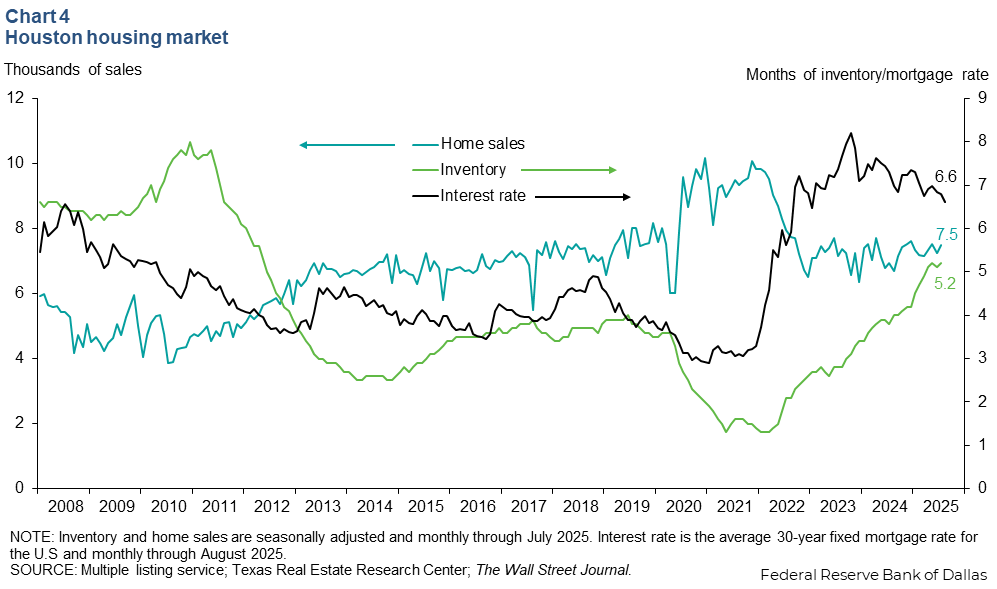
Houston’s inventory of homes ticked back up to 5.2 months of supply in July 2025 (Chart 4) as more people listed their homes for sale. The level of inventory has risen markedly since December 2024 when supply of homes in Houston was measured at 4.2 months. Existing home sales increased slightly to 7,506 in July from 7,233 in June but remained little changed from 7,614 sales in December 2024.
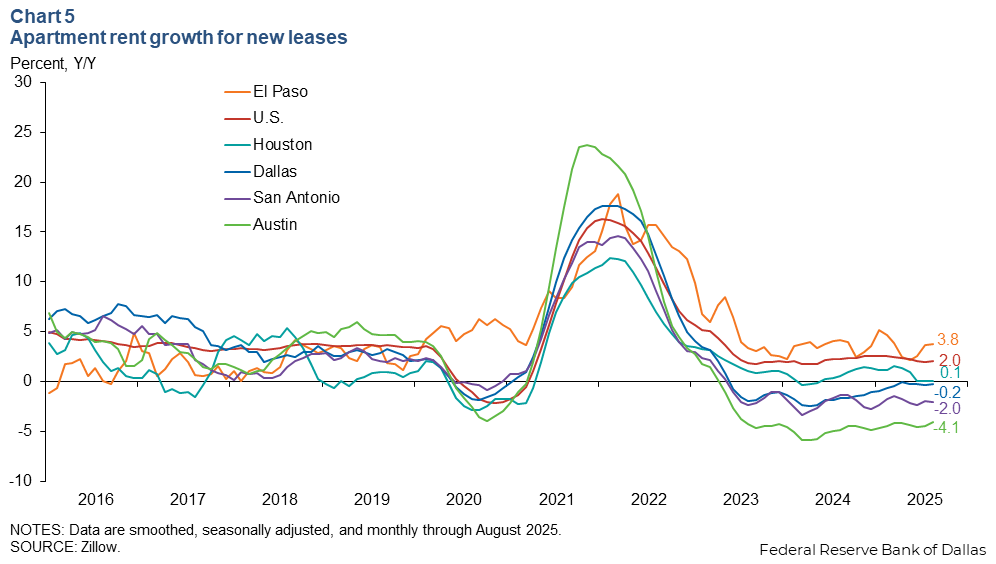
Apartment rent growth flat in Houston
Nominal apartment rents for new leases measured by the Zillow Observed Rent Index grew just 0.1 percent year over year in August (Chart 5). Rent growth over the past year held steady before falling off in early summer. In August 2024, apartment rents in Houston grew 0.5 percent annually.
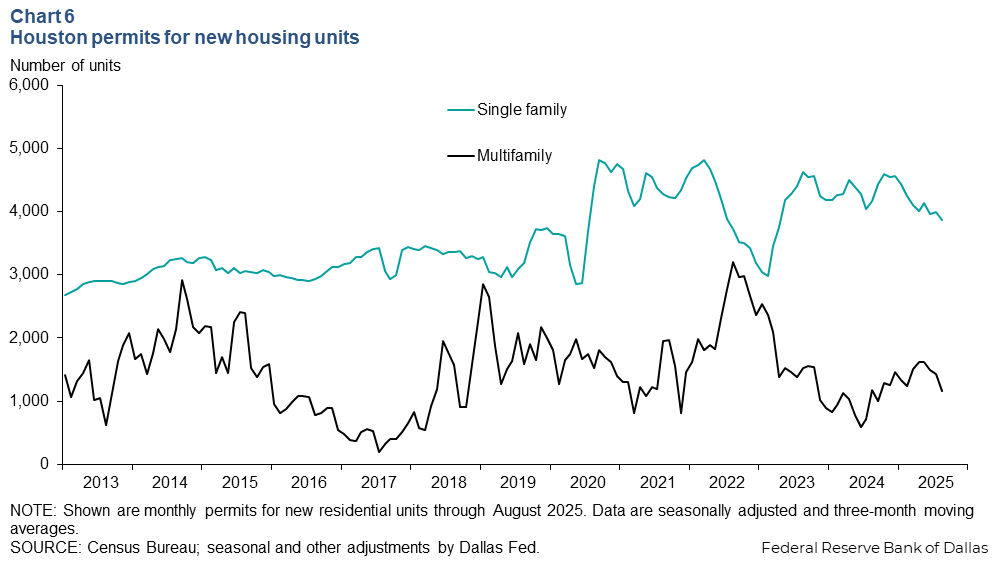
Single family homebuilding cools
The three-month moving average of building permits for single-family homes in the Houston metro area fell to 3,872 in August 2025 from 4,127 in May 2025 (Chart 6). Year over year, single-family permits fell 7.0 percent.
Permits for multifamily units decreased to 1,156 in August 2025 from 1,618 in May 2025. Year over year, multifamily permits fell 2.1 percent. Multifamily permits were trending upwards from mid-2024, but recent data may indicate a turning point in this trend.
NOTE: Data may not match previously published numbers due to revisions.
About Houston Economic Indicators
Questions or suggestions can be addressed to Robert Leigh at robert.leigh@dal.frb.org. Houston Economic Indicators is posted on the second Monday after monthly Houston-area employment data are released.