Houston Economic Indicators

| Houston economy dashboard (December 2025) | |||||
| Job growth (annualized) Sep.–Dec. '25 |
Unemployment rate |
Avg. hourly wages (nominal) | Avg. hourly wages y/y (nominal) |
||
| -0.2% | 4.6% | $36.58 | 2.6% | ||
Houston’s labor market contracted from September through December 2025. Early benchmarking of employment data removed previously estimated job gains, bringing full-year 2025 job growth in Houston to near zero on-net. Despite wavering job growth, unemployment declined in the fourth quarter and is little changed from last year. However, real wages declined from September through December.
Labor market
Labor market slows, but some sectors push forward
Houston payrolls contracted slightly over the fourth quarter, declining an annualized 0.2 percent (-1,470 jobs).
Solid growth in finance, trade and construction was netted out by declines in government and professional services. Financial activities grew an annualized 4.0 percent (1,750) over the three months ending in December. Trade, transportation and utilities grew an annualized 1.5 percent and added 2,520 new jobs to the local economy, the most of any sector. Government employment contracted 4.0 percent (-4,670) as many federal employees that accepted voluntary separation packages were officially removed in September. The large professional and business services sector declined an annualized 3.1 percent (-4,370) driven by a pullback in high-tech employment, legal services and accounting and payroll services.
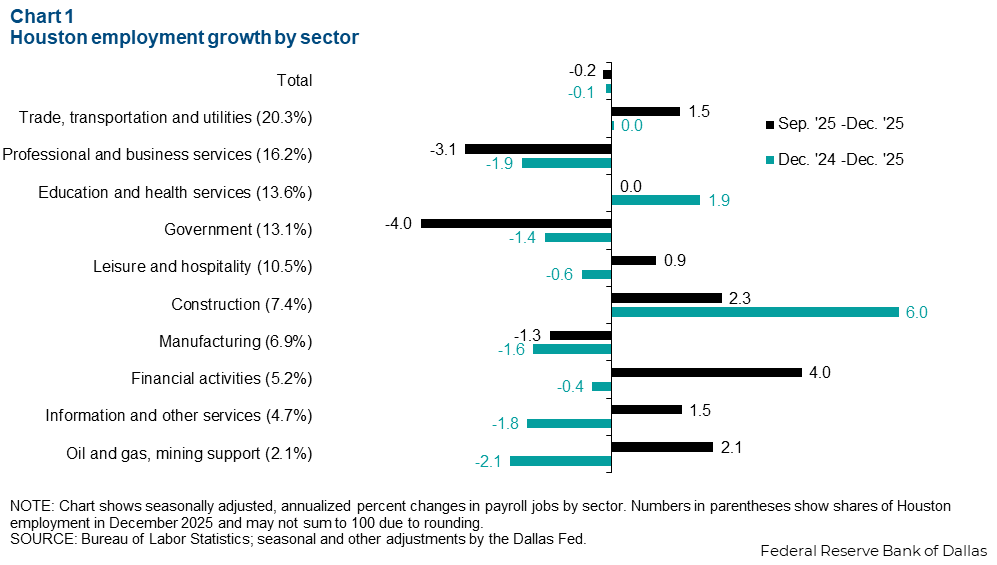
Year over year, job growth was flat, declining just 0.1 percent (-3,580 jobs) from December 2024 to December 2025. Growth occurred on a narrow base. Only the construction and education and health sectors grew solidly last year. Employment in construction expanded 6.0 percent (14,450) year over year while education and health grew 1.9 percent (8,620). A decline of 1.9 percent (-10,750) in professional and business services weighed heavily on the metro area’s growth.
The slowdown in 2025 is the result of multiple factors including a national trend of low hiring and low firing, reduced net migration and weak oil prices. Despite mining making up just 2.1 percent of the local economy, many manufacturers and service sector firms are tied to the energy sector. A slowdown in oil and gas can diffuse across the entire local economy.
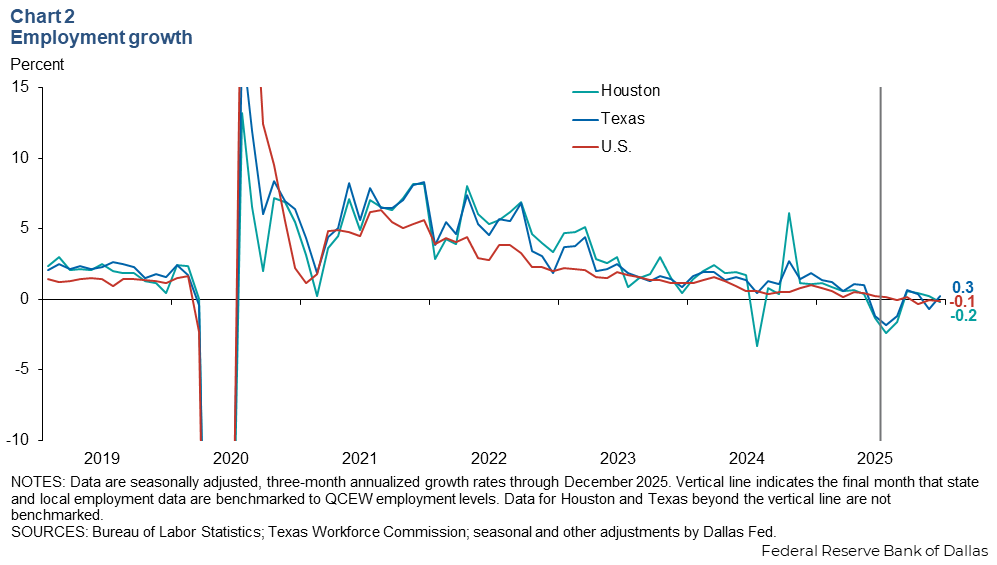
Houston labor market slows with the state and nation
Houston’s 0.2 percent annualized employment decline in the fourth quarter lags Texas but is in-line with the nation. In the fourth quarter, state payrolls expanded an annualized 0.3 percent while national payrolls declined 0.1 percent. The three-month change in employment is generally preferred for showing recent labor market growth while smoothing out the noise of month-to-month job growth rates.
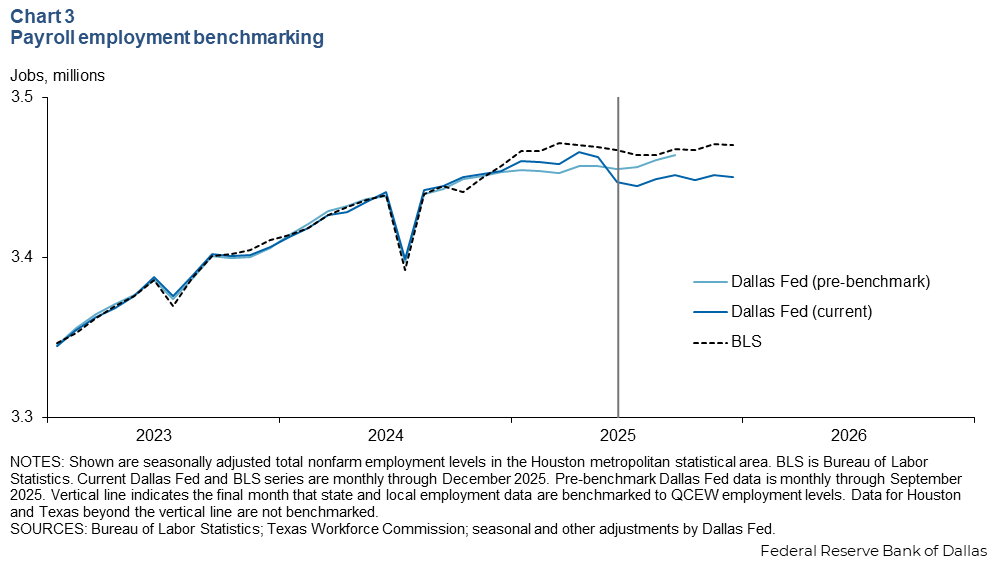
Early benchmark revisions reveal job losses.
Houston’s job growth through September 2025 was weaker than initially estimated. While the Bureau of Labor Statistics benchmarks its data annually, the Dallas Fed benchmarks employment data early, with quarterly releases. The Dallas Fed’s latest revision to employment data using the second-quarter Quarterly Census of Employment and Wages erased 12,000 jobs on net from Houston payrolls for September 2025 (Chart 3). This translates to an annualized 0.1 percent decline in employment from December 2024 through September 2025 compared to an initially estimated 0.4 percent annualized growth.
Unemployment declines in fourth quarter
The Houston unemployment rate declined to 4.6 percent in December from 4.7 in September (Chart 4). Texas unemployment increased to 4.3 percent from 4.1 over the same period. U.S. unemployment is unchanged at 4.4 percent in compared with three months prior.
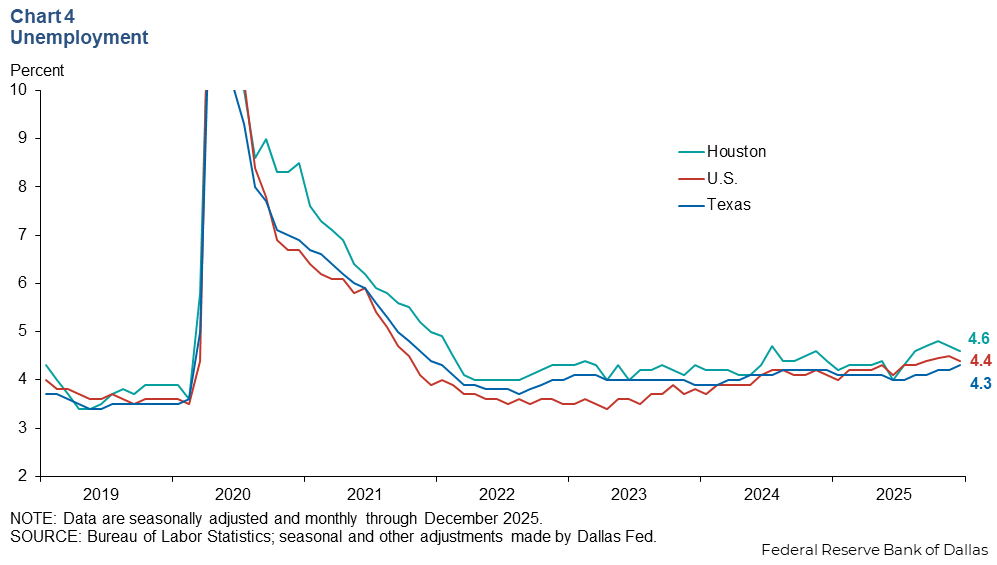
The decline in the unemployment rate in the fourth quarter is the result of a drop in the number of unemployed workers. Houston’s labor force grew an annualized 0.3 percent over the three months ending in December. From December 2024 to December 2025, the metro area’s labor force grew 1.0 percent, slower than the 10-year annualized labor force growth rate of 1.8 percent.
Earnings fall in December
Average hourly earnings in Houston were $36.44 per hour in December, down from $36.83 in September after adjusting for inflation and seasonality (Chart 5). Year over year, real earnings increased 0.9 percent.
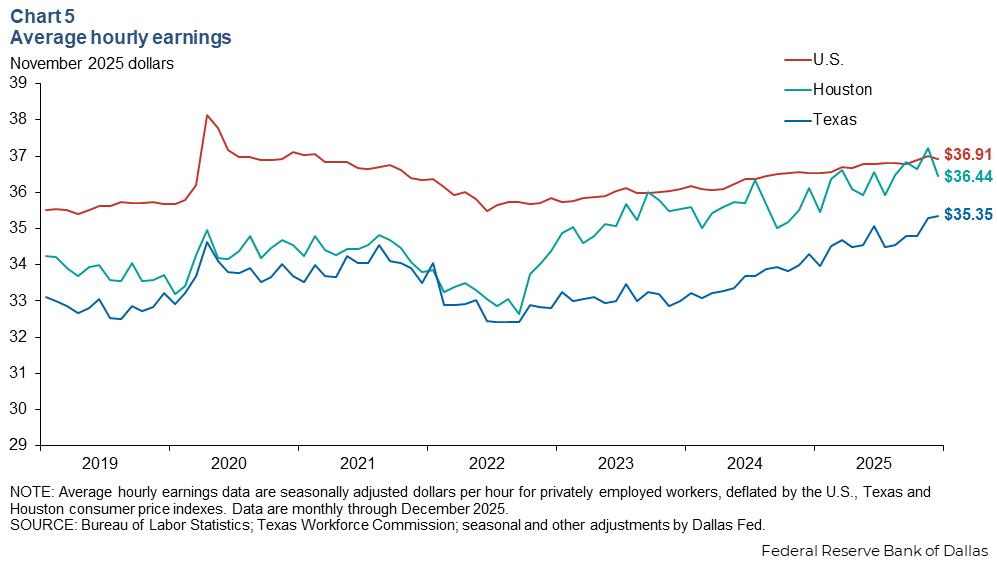
Houstonians’ real hourly earnings in December were below the national average of $36.91 per hour. Real earnings in both Houston and the nation tend to be higher than the state overall. Texas’ real hourly earnings in December were $35.35. Houston’s unique industry mix tends to boost average wages in the metro area compared with other areas in Texas.
Unadjusted for inflation or seasonality, wages rose 2.6 percent year over year to $36.58 per hour in December.
Note
Data may not match previously published numbers due to revisions.
NOTE: Data may not match previously published numbers due to revisions.
About Houston Economic Indicators
Questions or suggestions can be addressed to Robert Leigh. Houston Economic Indicators publishes bimonthly after state and metro area employment data are released.