Houston Economic Indicators

| Houston economy dashboard (February 2026) | |||||
| Job growth (annualized) Nov. '25–Feb. '26 |
Unemployment rate |
Avg. hourly wages (nominal) | Avg. hourly wages y/y (nominal) |
||
| 1.2% | 4.6% | $36.43 | 1.1% | ||
The pace of growth in Houston’s labor market was modest from November 2025 through February 2026. From February 2025 through February 2026, employment in the metro was nearly flat. Strength in the Houston Purchasing Managers Index and Houston Leading Index suggests the pace of job growth will pick up over the next 4 to 9 months. The Texas rig count ticked up in March. Due to higher oil prices and geopolitical disruption, gasoline prices in Houston have increased 58 percent from January through mid-April.
Labor market
Houston payrolls grew 1.2 percent annualized (10,300 jobs) over the three months ending in February (Chart 1).
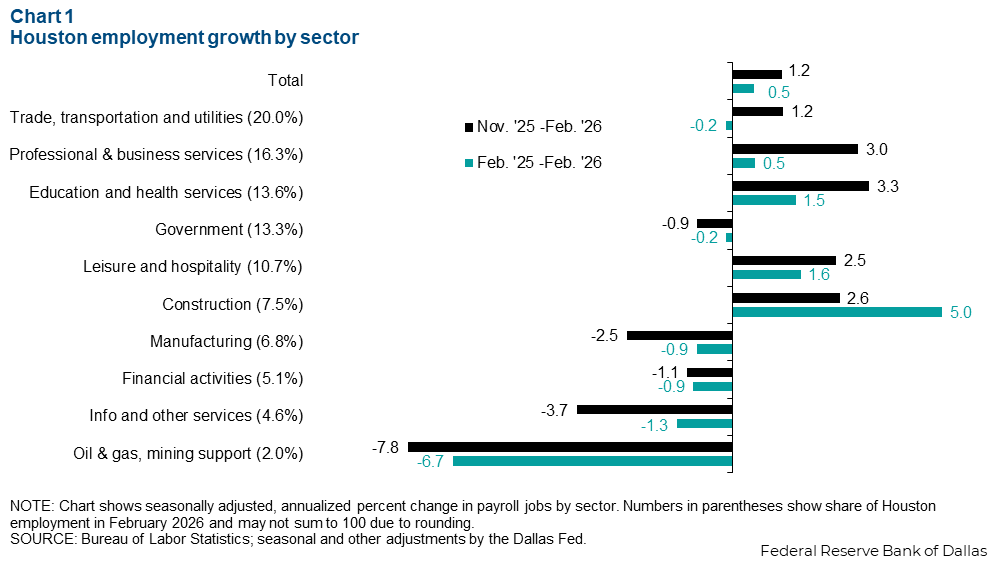
From November 2025 through February 2026, education and health services grew an annualized 3.3 percent (3,800 jobs). Professional and business services grew 1.5 percent with actual growth of 4,200 jobs leading all sectors. Leisure and hospitality and construction also posted solid growth. There was a notable pullback in oil and gas extraction and mining support activities. The sector declined an annualized 7.8 percent (-1,400 jobs). Information and other services contracted 3.7 percent annualized (-1,500 jobs). Manufacturing and financial services also contracted. Job losses in manufacturing were concentrated in nondurable goods, particularly petroleum products.
Year over year, job growth in February 2026 was flat at just 0.5 percent (18,100 jobs). Over the same period, the construction sector grew a notable 5.0 percent (12,500 jobs). Leisure and hospitality and education and health services also grew modestly. Oil and gas employment saw a significant year-over-year reduction, contracting 6.7 percent (-5,000 jobs). Houston’s labor market from February 2025 to February 2026 reflects trends at the national and state levels. A nationwide reduction in both labor supply and demand has slowed job growth to very low levels.
Purchasing Managers Index
Houston labor market slows with the state and nation
The Houston Purchasing Managers Index (HPMI) increased to 52.3 in March 2026 from 50.2 in December 2025 as a larger share of respondents reported expanding economic conditions (Chart 2). Index values above 50 indicate expansion, while those below 50 indicate contraction. The subcomponents of HPMI showed an uptick in sales, employment and raw materials purchases. However, the production index turned negative, and input price growth surged.
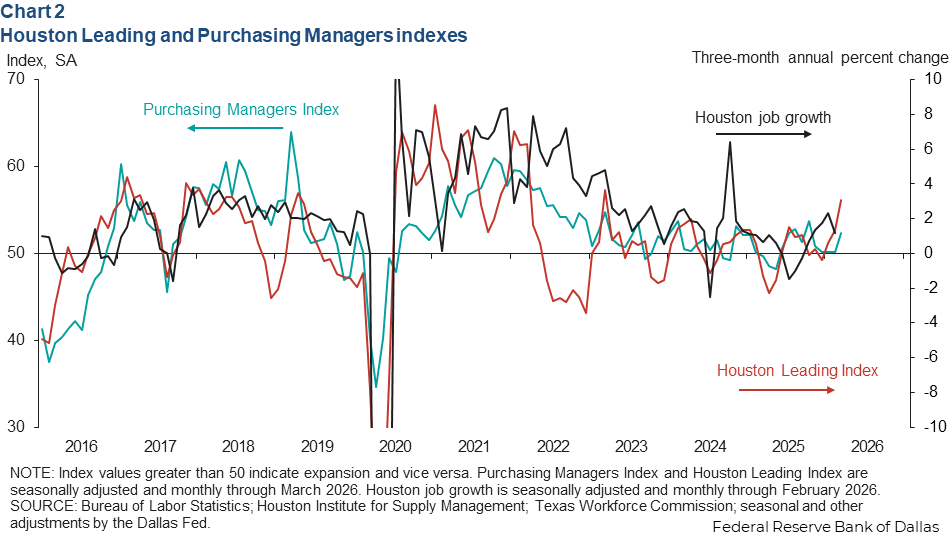
The Houston Leading Index (HLI) accelerated to 3.1 percent growth over the three months ending in March from -0.4 percent growth over the three months ending in December. The acceleration was driven by higher oil prices, chemical railcar loadings and equity prices.
Positive readings in the HPMI and HLI suggest a future acceleration in local job growth. However, the contraction in the HPMI production index and steep acceleration in the input price index (likely due to higher oil prices) bear watching, particularly if domestic demand is unable to support increased selling prices. While an increase in oil prices is typically supportive of Houston’s economy, the current shock is still viewed as transitory, with only modest increases to energy industry capital expenditures and employment expected at this time.
Oil and gas
Rig count ticks up in March
The monthly average number of active rotary rigs in Texas increased slightly from 229 in December 2025 to 234 in March 2026. Over the same period, the number of new wells drilled in Texas’ major oil- and gas-producing regions declined from 617 to 607. The rig count and well completions are shown in Chart 3 as indexes.
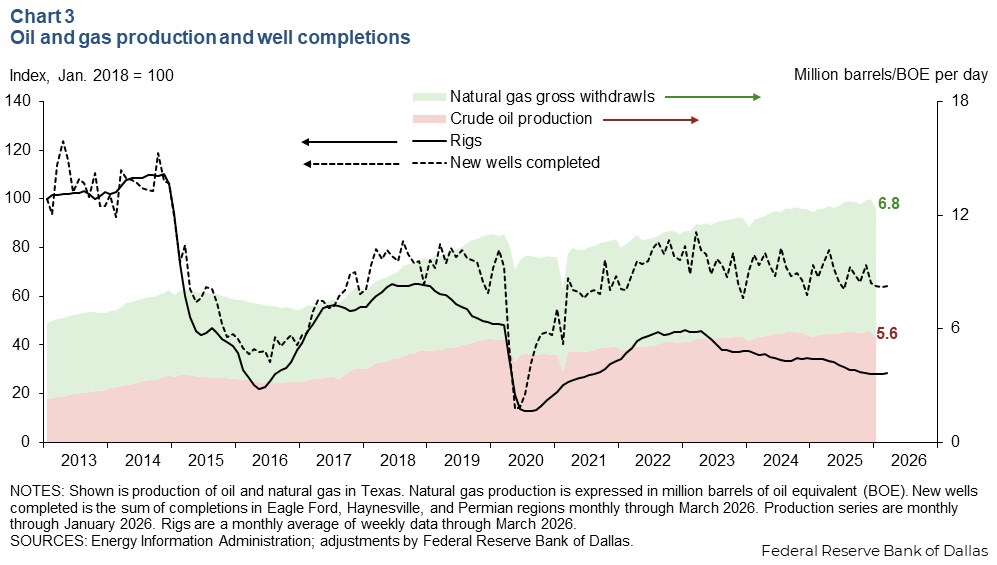
Oil and gas production data is more lagged. Over the three months ending in January, oil production in Texas declined 3.4 percent to 5.6 million barrels per day, and natural gas production declined 1.0 percent to 6.8 million barrels of oil equivalent (37.1 billion cubic feet) per day.
It takes about 6 to 8 months for production to show material growth in response to higher prices. The recent surge in oil prices will likely contribute to modest gains in oil production by the end of the year.
Retail gasoline prices surge
The average retail price of gasoline in Houston hit $3.63 per gallon the week of April 20, a 57.7 percent increase from $2.30 per gallon the week of Jan. 19. Over the same time, the average price of U.S. Gulf Coast on-highway diesel increased 56.1 percent to $5.07 per gallon (Chart 4).
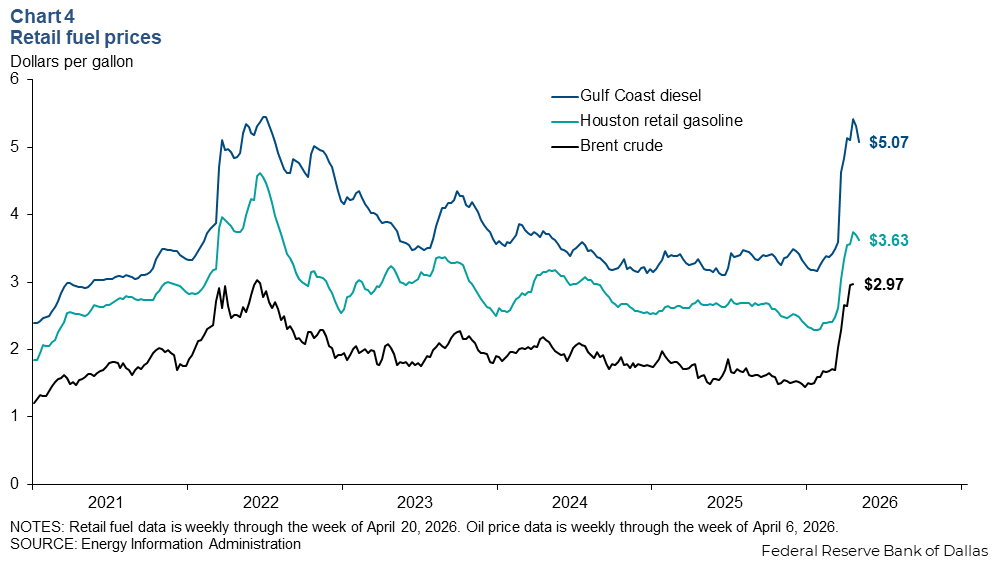
Gas prices are most closely tied with Brent, the worldwide benchmark price for crude oil. The price of Brent nearly doubled from $1.50 per gallon the week of Jan. 5 to $2.97 per gallon the week of April 6. Crude oil costs contribute about half of the total retail price of motor fuels.
Note
Data may not match previously published numbers due to revisions.
NOTE: Data may not match previously published numbers due to revisions.
About Houston Economic Indicators
Questions or suggestions can be addressed to Robert Leigh. Houston Economic Indicators publishes bimonthly after state and metro area employment data are released.