Permian Basin Economic Indicators

Wages in the Permian Basin fell for the second quarter in a row after spiking in first quarter 2017. The rig count, crude oil production and oil prices all rose in January, but oil prices have stumbled somewhat in February. Existing-home sales picked up again, but prices remain stable.
Wages
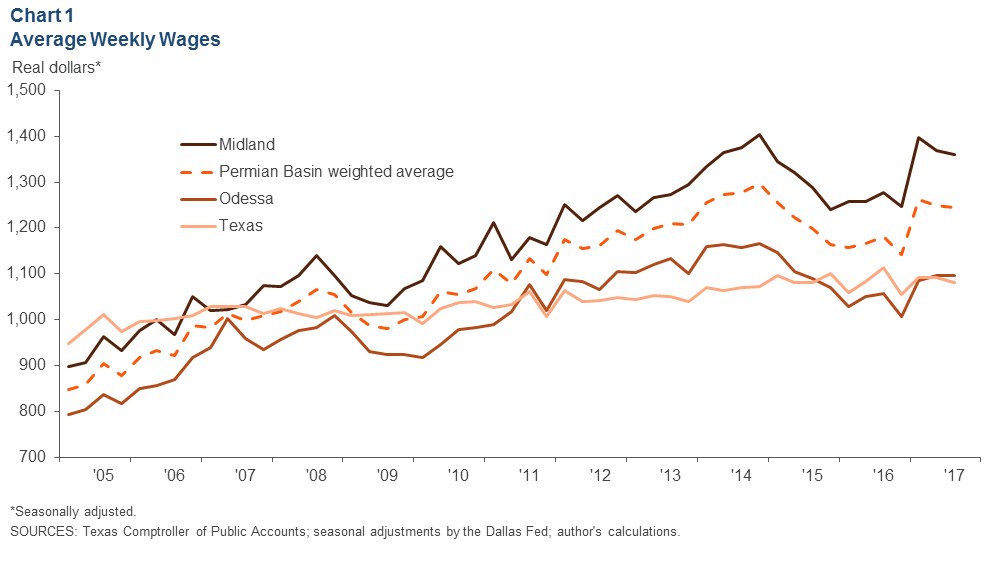
Average weekly wages fell 0.3 percent in the Permian Basin, while wages fell by almost 1 percent statewide between second quarter 2017 and third quarter 2017 (Chart 1). The Permian Basin’s decline was led by Midland’s drop of 0.6 percent. The average weekly wage in the Permian during third quarter 2017 was over $1,200—about 15 percent more than the Texas average. This is likely because of the larger share of energy jobs in this area relative to the state’s job market.
Energy
Oil Production Growth Streak Continues, Rig Count Improves
The Permian Basin’s rig count rose to 410 rigs in January 2018—an increase of 12 rigs from the prior month and the highest since January 2015 (Chart 2).
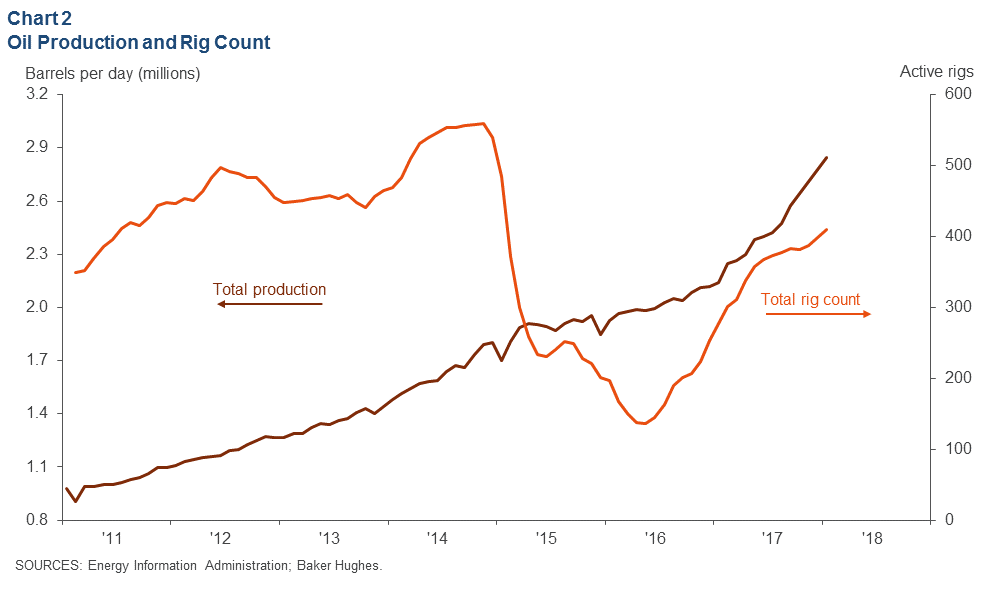
Permian Basin production grew to 2.85 million barrels per day (b/d) in January—an increase of 69,000 b/d from December. Production has increased by around 70,000 b/d every month since October 2017, and the Energy Information Administration (EIA) expects the trend to continue in February. The EIA recently raised its forecast for 2018 U.S. crude oil production to an average of 10.6 million b/d, 0.3 b/d more than January’s forecast. This would break the record of 9.6 million b/d set in 1970.
Price of West Texas Intermediate Increases
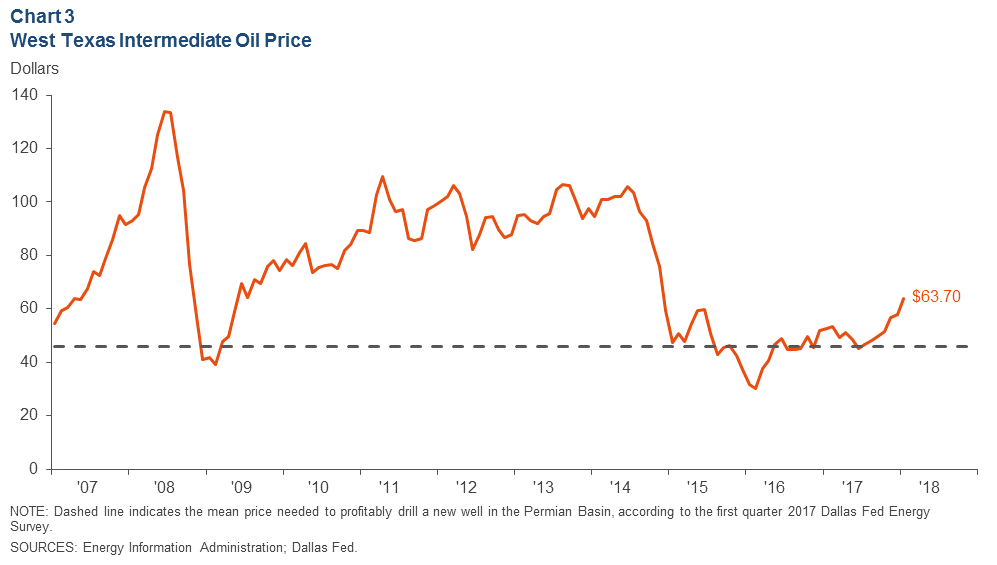
The average West Texas Intermediate (WTI) crude spot price increased from $57.88 per barrel in December to $63.70 in January (Chart 3). The spot price’s increase was driven by strong oil demand expectations and solid OPEC compliance, among other factors. The price of WTI has cooled somewhat in February as strong production expectations for 2018 were reported.
Drilled but Uncompleted Wells Rise in Permian
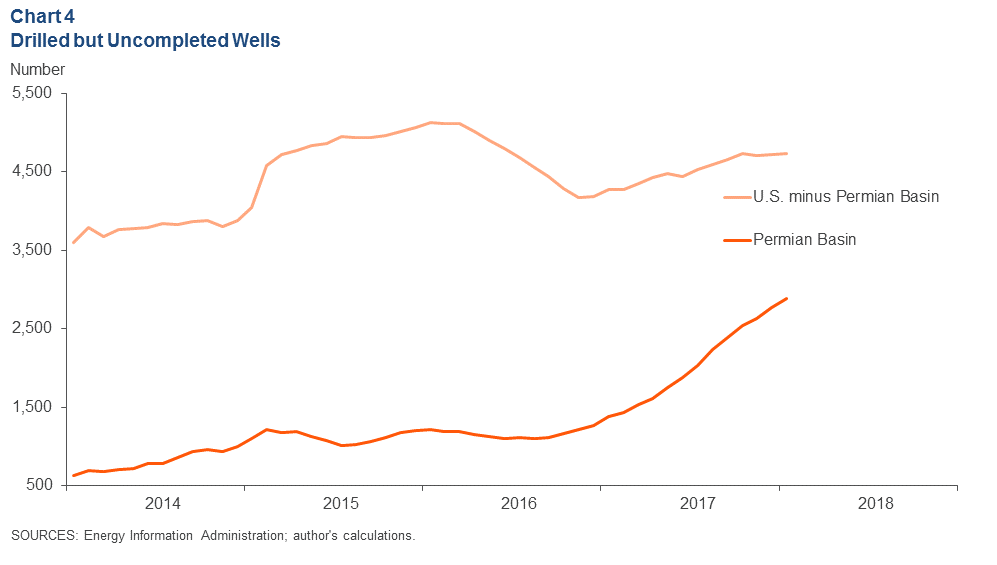
The number of drilled but uncompleted wells (DUCs) increased by 4 percent in the Permian Basin between December and January, while the rest of the U.S. basins’ DUC count only increased slightly (Chart 4). The Permian’s DUC count has more than doubled from January 2016 to January 2017, while the rest of the U.S. basins’ counts only rose 11 percent.
Housing
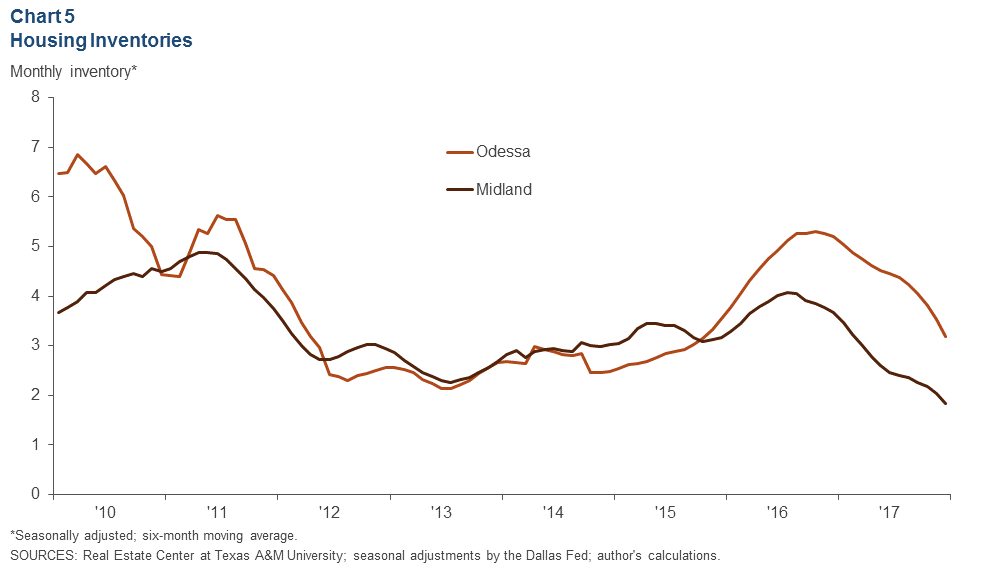
Housing Inventories Fall Further
Midland–Odessa’s supply of existing homes continued to tighten in December 2017 (Chart 5). The six-month moving average for months of inventory ended 2017 at 1.8 in Midland and 3.2 in Odessa—a year-over-year decrease of about two months in both markets. Total listings have fallen by about one-third from December 2016 to December 2017.
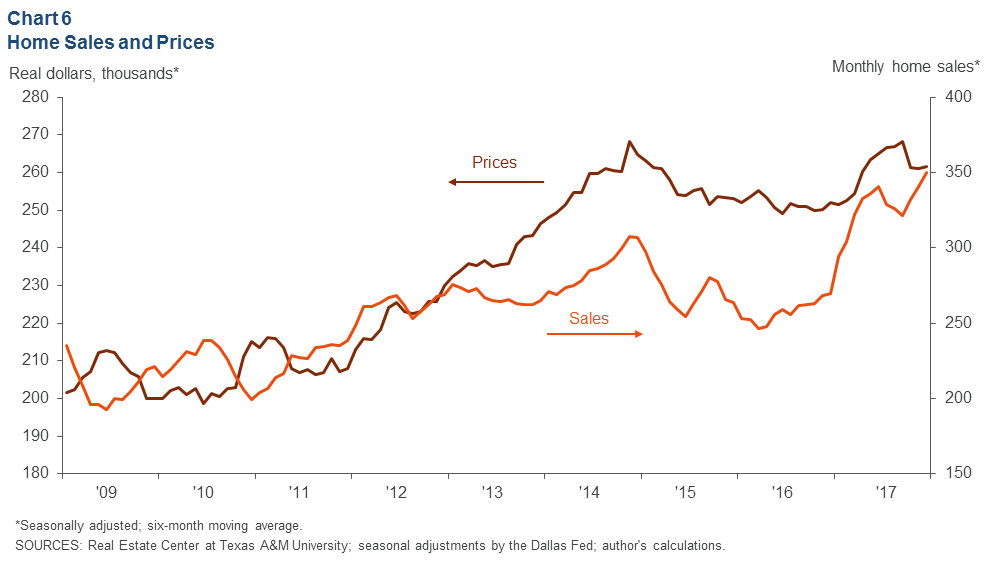
Home Sales Surge, Prices Hold Steady
Though the six-month moving average for sales of existing homes surged to 350 between August and December 2017, prices remained unchanged in the last two months of the year (Chart 6). December 2017 sales were 30 percent higher than in December 2016. The average price of a home increased by only 4 percent in the same period.
NOTES: Data are for the Midland–Odessa metropolitan statistical area (Martin, Midland and Ector counties), except for energy data, which cover the 55 counties in West Texas and southern New Mexico that make up the Permian Basin region. Data may not match previously published numbers due to revisions.
About Permian Basin Economic Indicators
Questions can be addressed to Dylan Szeto at Dylan.Szeto@dal.frb.org. Permian Basin Economic Indicators is released on the third Wednesday of every month.