Permian Basin Economic Indicators

The Permian Basin economy remains robust. Employment growth has moderated in recent months, but the unemployment rate remains at historical lows. Though growth in the rig count has slowed, the Permian Basin still seems to be buzzing with energy activity. Housing indicators have cooled somewhat in terms of sales and pricing, but inventories indicate continued tightness in the market.
Labor Market
Permian Basin employment stayed essentially flat between August and September, growing at a 0.2 percent annualized rate (Chart 1). Payroll employment in September rose to 184,000, with growth in the third quarter posting its slowest quarterly increase since 2016. These results are in line with the Dallas Fed Energy Survey, which suggested firms increased employment during the third quarter but at a slower rate than the second quarter.
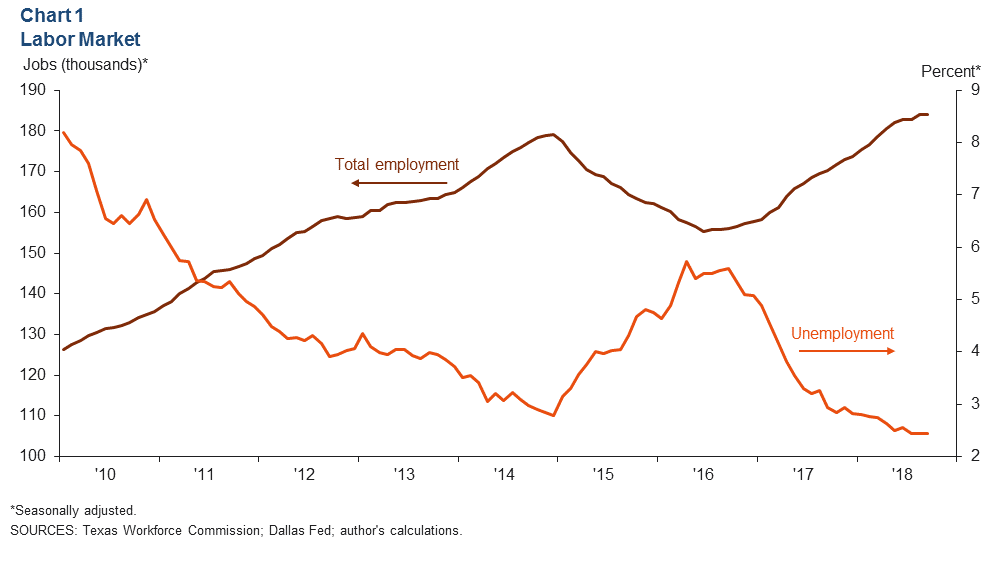
The unemployment rate stayed flat at 2.4 percent between August and September. The third-quarter Dallas Fed Energy Survey noted firms are increasing hours and wages and benefits, but the rate of growth in both indexes slowed.
Energy
Oil Production Grows at Slower Rate; Rig Count Levels Off
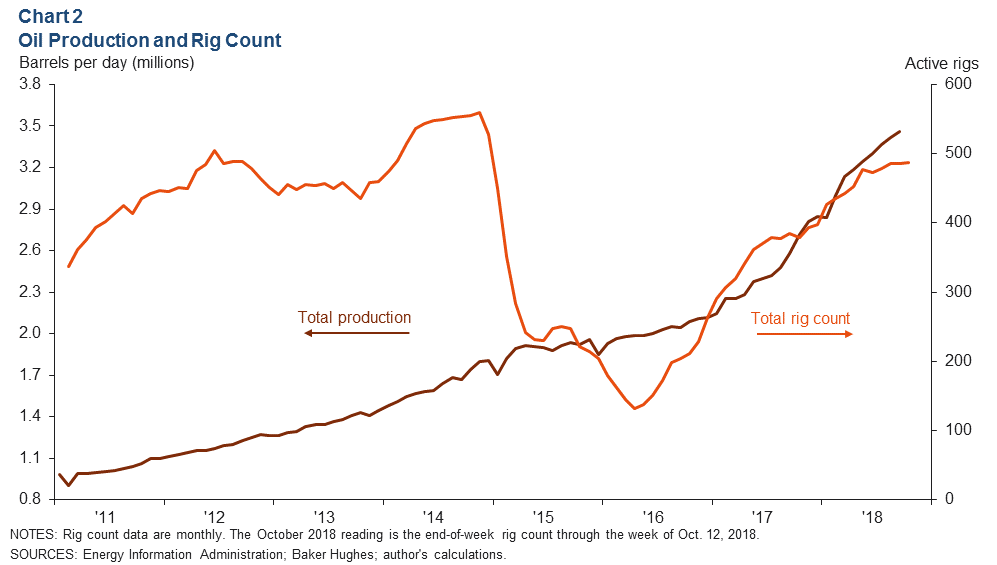
Permian Basin oil production advanced about 1.3 percent to 3.46 million barrels per day between August and September (Chart 2). Month-over-month growth in oil production has slowed recently, but production is still over 34 percent higher than it was a year ago. Growth in production has surpassed takeaway capacity. The third-quarter Dallas Fed Energy Survey shows that 56 percent of industry contacts expect pipeline capacity constraints to be alleviated by the end of 2019. The Permian Basin rig count showed no change between August and September, remaining at 486 rigs, and was up by one rig to 487 as of Oct. 12.
Price of West Texas Intermediate Ticks Up in September
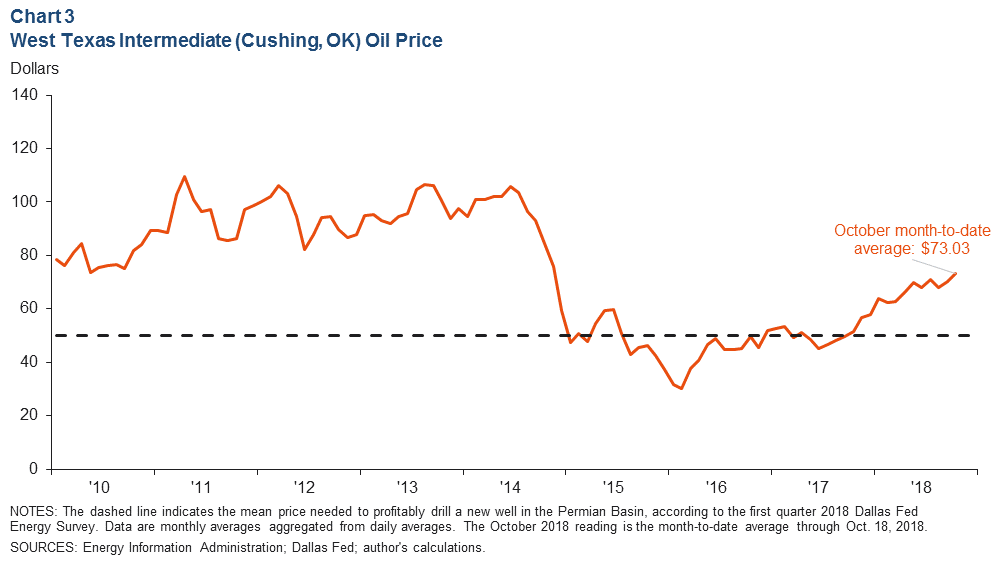
A lower production growth forecast by the Energy Information Administration in September and a drop in Iranian exports helped push up crude prices. West Texas Intermediate (WTI) crude oil averaged $70.23 per barrel in September, up from $68.06 in August (Chart 3). The price of WTI Midland also picked up during September, but a lack of takeaway capacity kept it priced lower than WTI Cushing. However, the spread between WTI Cushing and WTI Midland has narrowed somewhat during October, in part because of the anticipated arrival of additional pipeline capacity in the near term. Eighty-seven percent of respondents to the third-quarter Dallas Fed Energy Survey said they expected crude price differentials between WTI Midland and WTI Cushing to have a negative impact on production.
Permian’s Drilled but Uncompleted Wells Still on the Rise
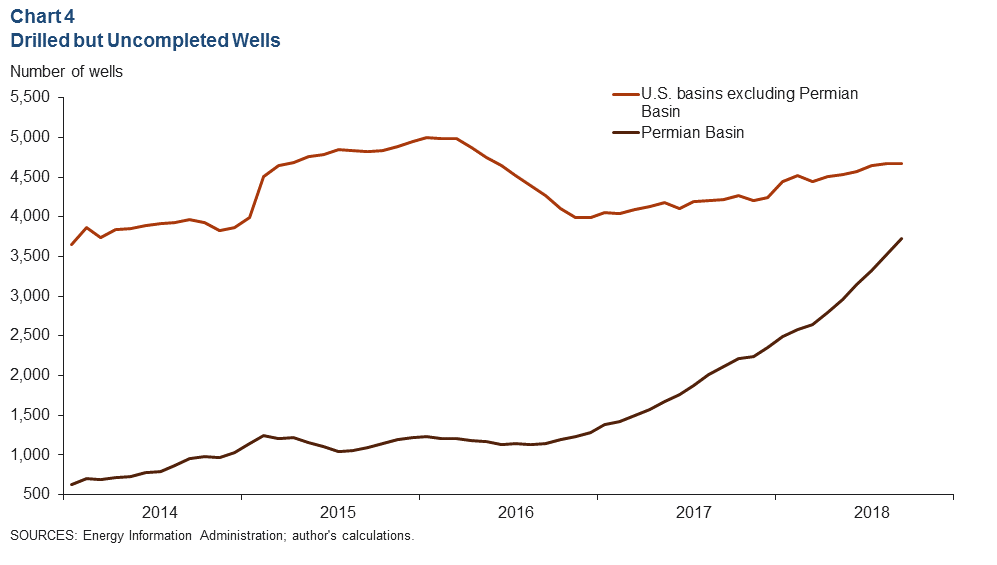
The Permian Basin’s number of drilled but uncompleted wells (DUCs) increased from 3,528 to 3,722 between August and September (Chart 4). Increases in the DUC count have stayed between 5 and 7 percent per month since April. With just under 4,670 DUCs, the U.S. DUC count for September was essentially unchanged from the previous month. The number of wells drilled in the Permian between January and September 2018 is up 40 percent over the same period last year.
Housing
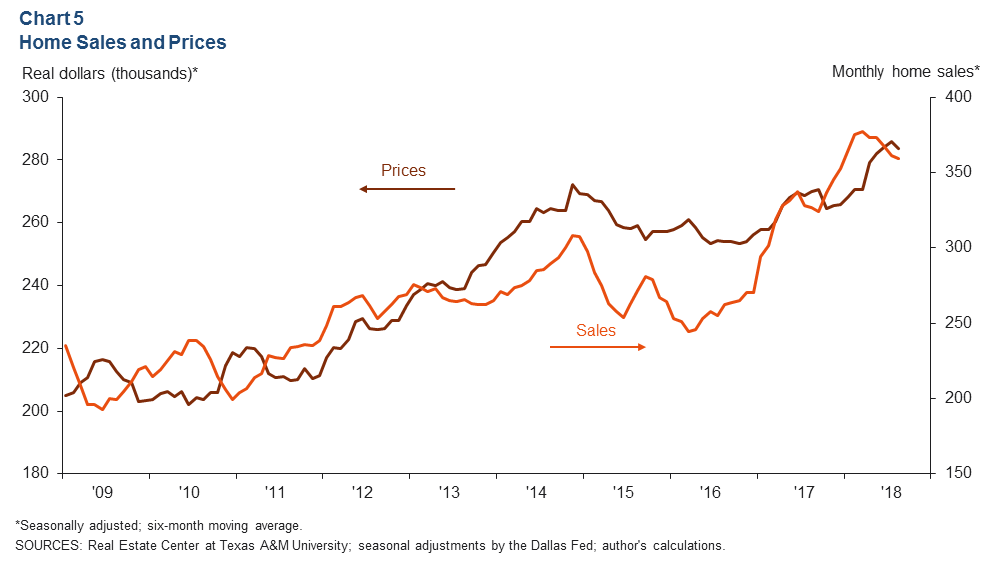
Home Sales and Prices Fall
The six-month moving average for Permian Basin home prices fell by less than 1 percent to about $284,000 in August after peaking at about $286,000 in July (Chart 5). Home sales fell by about 0.5 percent between July and August, but sales are still 10 percent higher than they were at the same time last year.
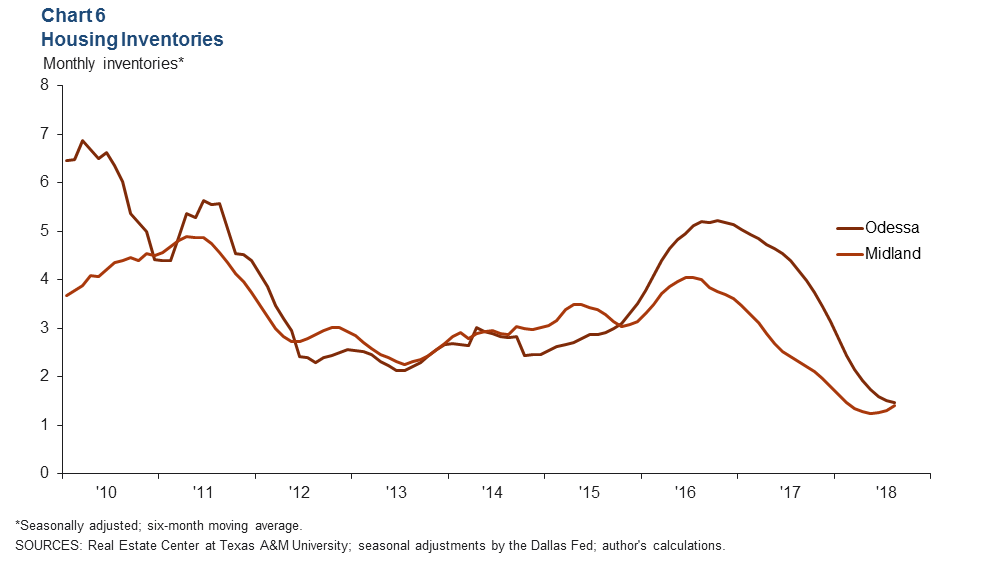
Inventory Remains Tight
Single-family homes inventory remains tight in Midland and Odessa (Chart 6). However, while Odessa’s months of inventory fell from 1.51 to 1.47 between July and August, Midland’s crept up from 1.32 to 1.4. Though total listings have grown for two months in a row, the August reading for Midland and Odessa was still down 42 percent from the same time last year.
NOTES: Data are for the Midland–Odessa metropolitan statistical area (Martin, Midland and Ector counties), except for energy data, which cover the 55 counties in West Texas and southern New Mexico that make up the Permian Basin region. Data may not match previously published numbers due to revisions.
About Permian Basin Economic Indicators
Questions can be addressed to Dylan Szeto at Dylan.Szeto@dal.frb.org. Permian Basin Economic Indicators is released on the third Wednesday of every month.