Permian Basin Economic Indicators

The Permian Basin economy remains robust despite the recent large drop in oil prices. Though employment has fallen slightly over the past three months, the Permian’s labor market continues to be tight. Oil production remains strong, and the rig count is still elevated. Housing continues to show strength with record home sales and elevated prices.
Labor Market
Employment fell for the third month in a row in November, down an annualized 7.8 percent to just below 185,500 workers (Chart 1). The number of workers is still less than 1 percent down from its August 2018 peak, and the Dallas Fed’s December Beige Book reported that energy companies are having difficulty finding workers for blue-collar positions.
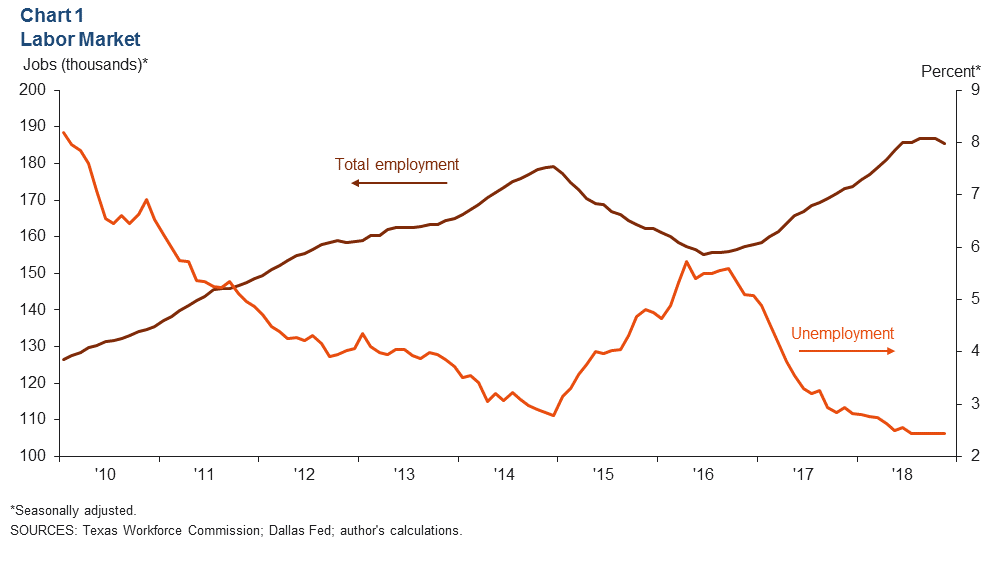
The Permian Basin’s unemployment rate stayed at 2.4 percent in November for the fifth month in a row, and the year-over-year growth of the area’s labor force has slowed since the first half of the year. The Permian’s unemployment rate remains significantly below the Texas and U.S. rates of 3.7 percent.
Energy
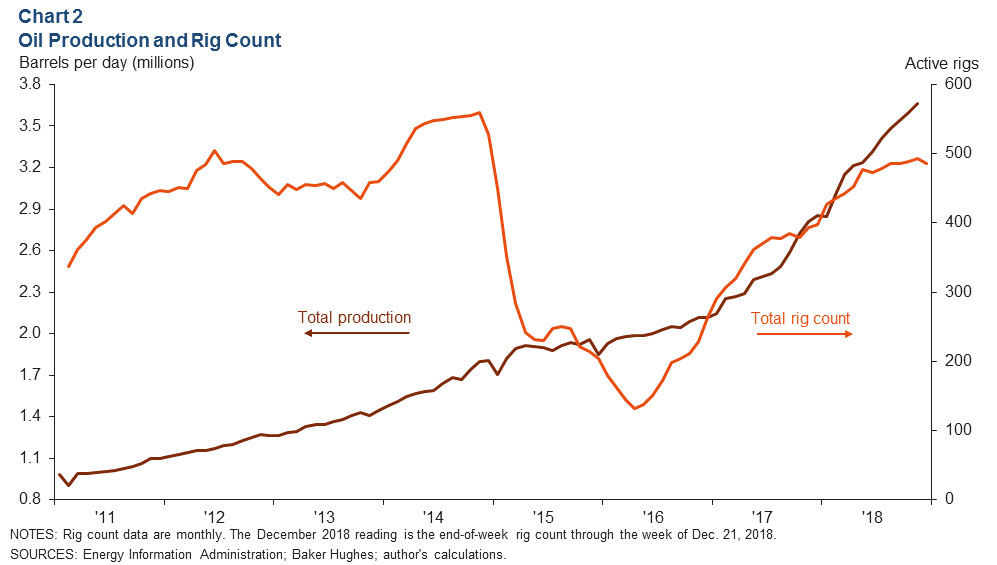
Oil Production Reaches Fresh Highs; Rig Count Growth Stalls
Permian Basin oil production is estimated to have reached 3.66 million barrels per day (b/d) in November, an increase of a little over 60,000 barrels from October (Chart 2). The Permian Basin rig count inched up by four rigs between October and November but slid by seven during December.
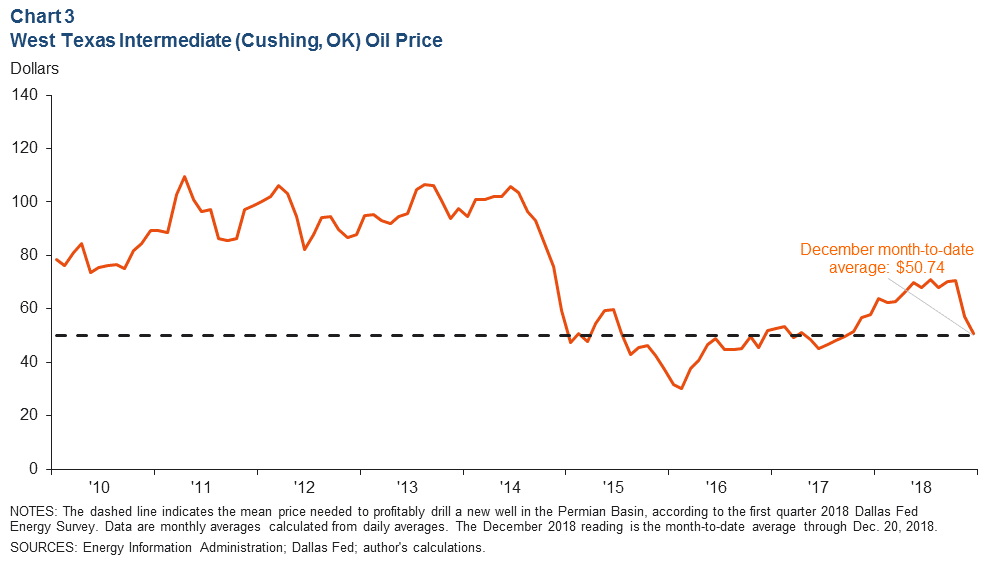
Price of West Texas Intermediate Drops
West Texas Intermediate (WTI) oil prices have fallen significantly in the last several weeks as U.S. oil production continued to grow, doubts arose about OPEC’s announced production cut, and global oil demand forecasts appeared to be lower than previous estimates (Chart 3). WTI has averaged $50.74 per barrel through Dec. 20, down by more than $6 from the November average.
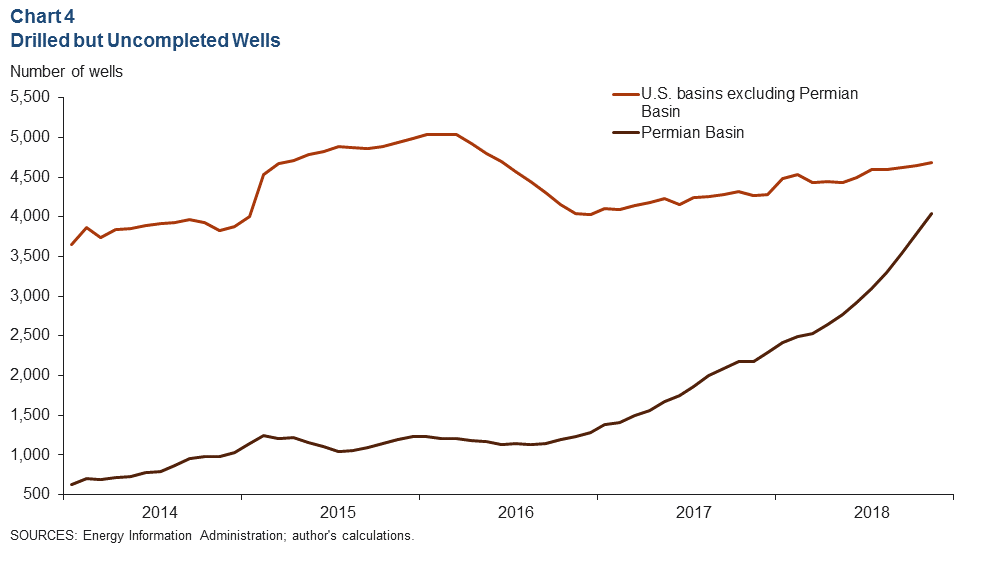
Almost Half of the U.S.’ Drilled but Uncompleted Wells Are in the Permian
The Permian’s number of drilled but uncompleted wells (DUCs) rose to over 4,000 in November, increasing by around 7 percent from October (Chart 4). DUCs outside of the Permian advanced but at a much slower pace. The Permian Basin now comprises just under half of the total DUCs in the U.S.
Housing
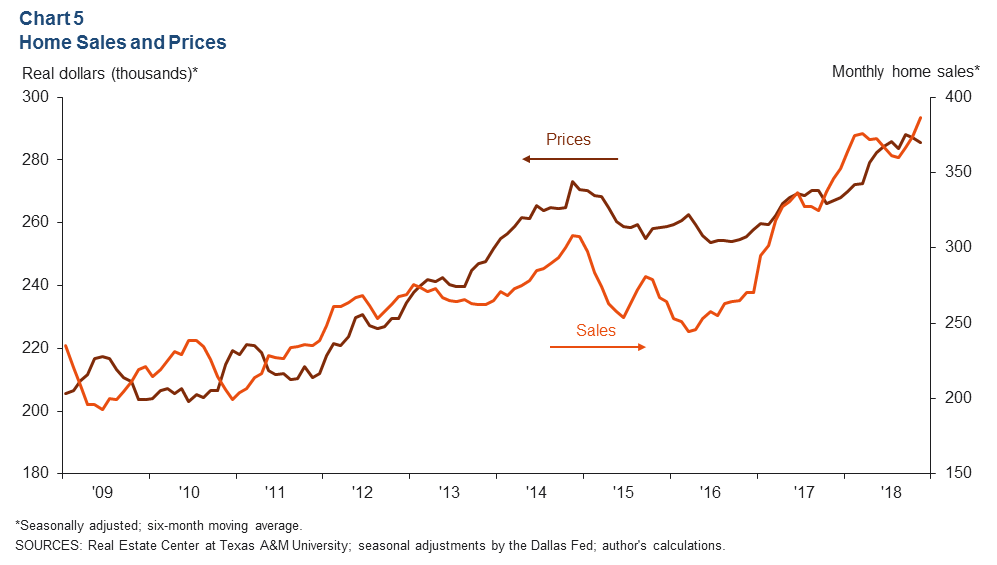
Sales Reach New High; Prices Remain Elevated in November
Existing-home prices remain elevated despite falling to $285,600 between October and November (Chart 5). Coinciding with elevated home prices is the Permian’s high number of sales. The Permian Basin reached a new record for home sales, with 387 homes sold between October and November. The Permian’s housing market has been strong all year with only two months of 2018 showing home sales growing less than 10 percent year over year.
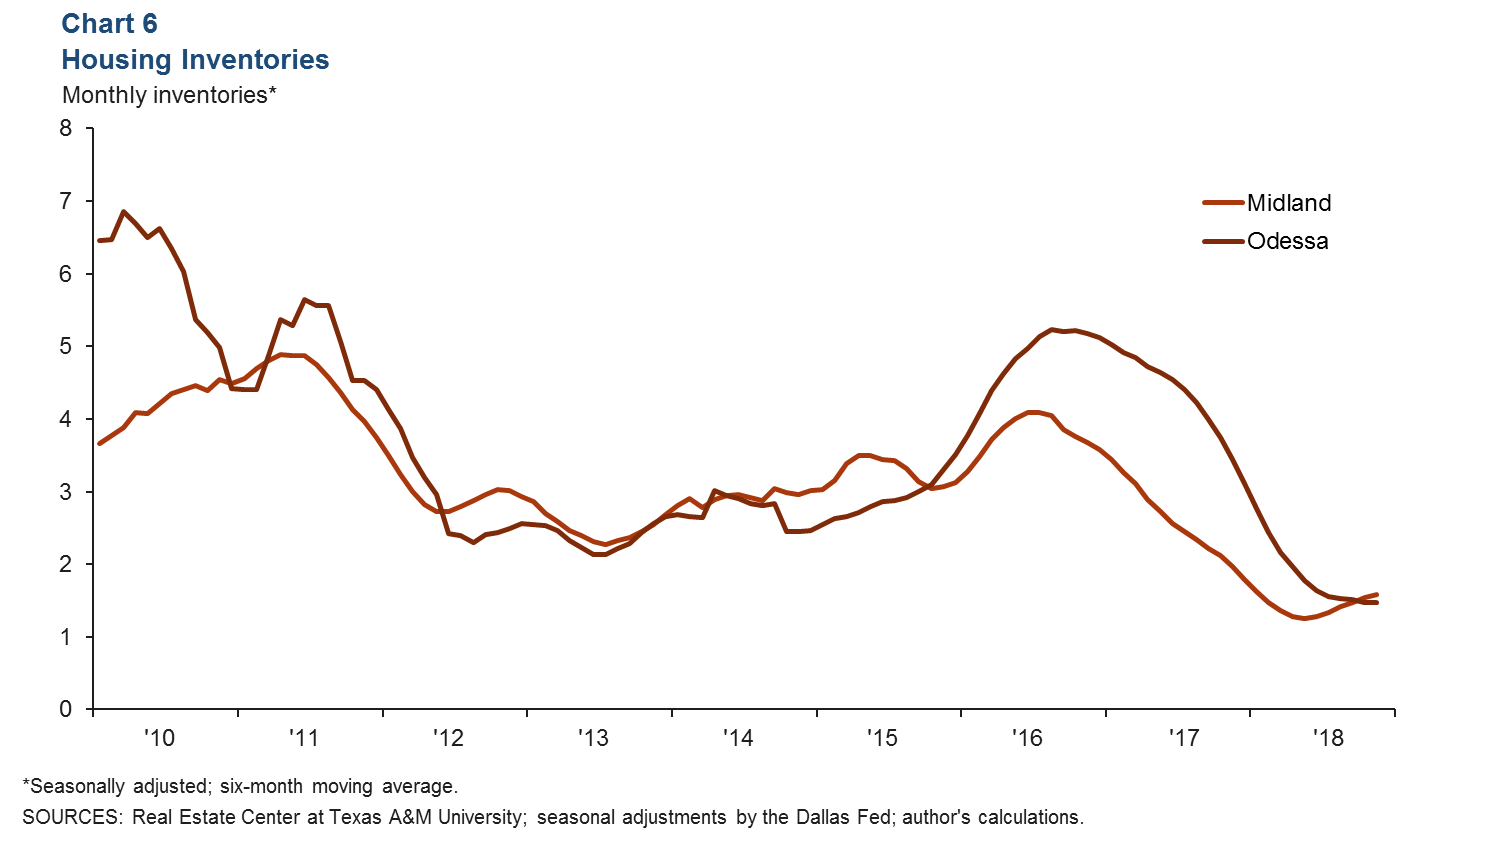
Inventory Remains Tight but Rises in Midland
Home inventories remain tight in Midland and Odessa, though Midland’s inventory has risen gradually over the last six months (Chart 6). Odessa’s inventories stayed steady between October and November. Midland’s rise in inventory is accompanied by a spike in its total listings.
NOTES: Data are for the Midland–Odessa metropolitan statistical area (Martin, Midland and Ector counties), except for energy data, which cover the 55 counties in West Texas and southern New Mexico that make up the Permian Basin region. Data may not match previously published numbers due to revisions.
About Permian Basin Economic Indicators
Questions can be addressed to Dylan Szeto at Dylan.Szeto@dal.frb.org. Permian Basin Economic Indicators is released on the third Wednesday of every month.