Permian Basin Economic Indicators

Production in the Permian Basin continues to grow even as the rig count remains steady. Permian Basin wages were well above the Texas average in December. The tight housing market has led to strong home-price appreciation.
Energy
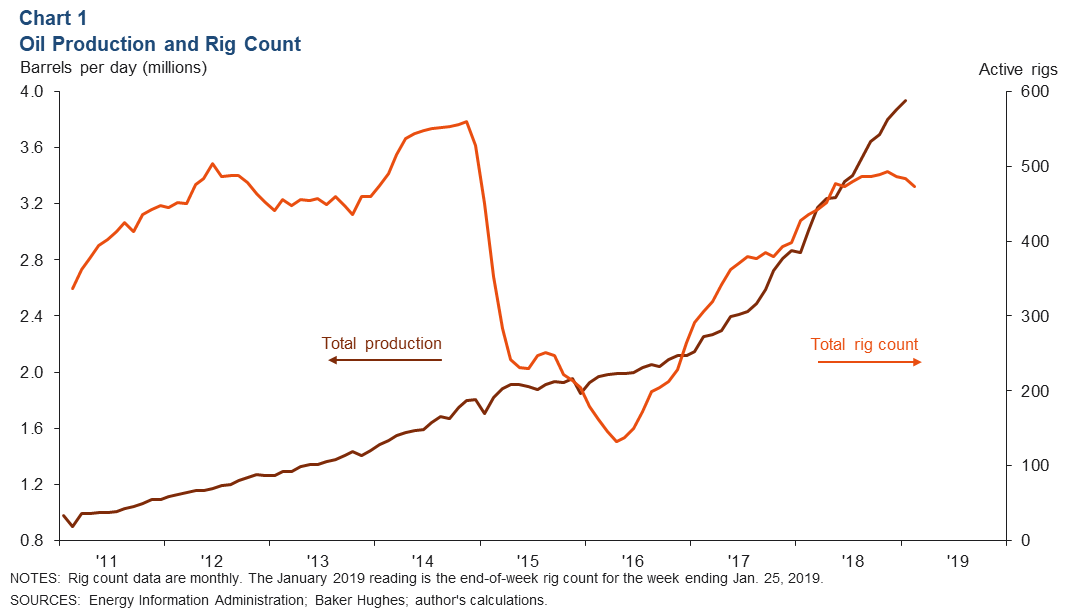
Oil Production Once Again Reaches New Highs
Permian Basin oil production is estimated to have reached 3.94 million barrels per day (b/d) in January, up from December’s 3.87 million b/d (Chart 1). Meanwhile, the Permian Basin rig count continues to inch down, falling to 473 in February from 484 in January—down from its most recent peak of 493 in November 2018.
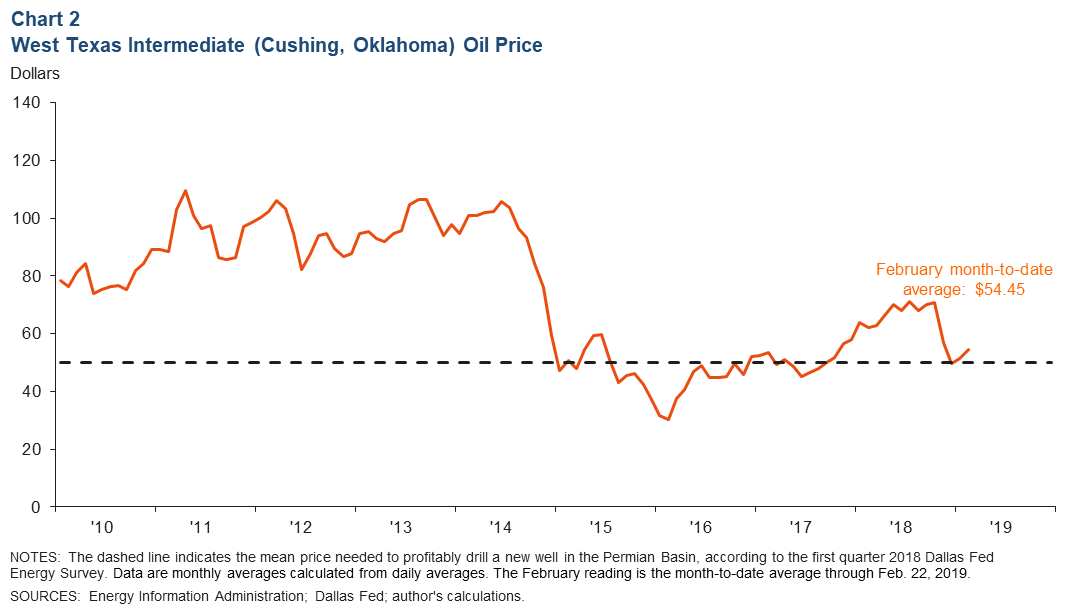
Price of West Texas Intermediate Rises
The West Texas Intermediate crude oil price recovered somewhat in February, averaging $54.45 per barrel, up from $51.38 in January (Chart 2).
According to the latest Dallas Fed Energy Survey, respondents expect prices to be near $59.97 per barrel by the end of 2019.
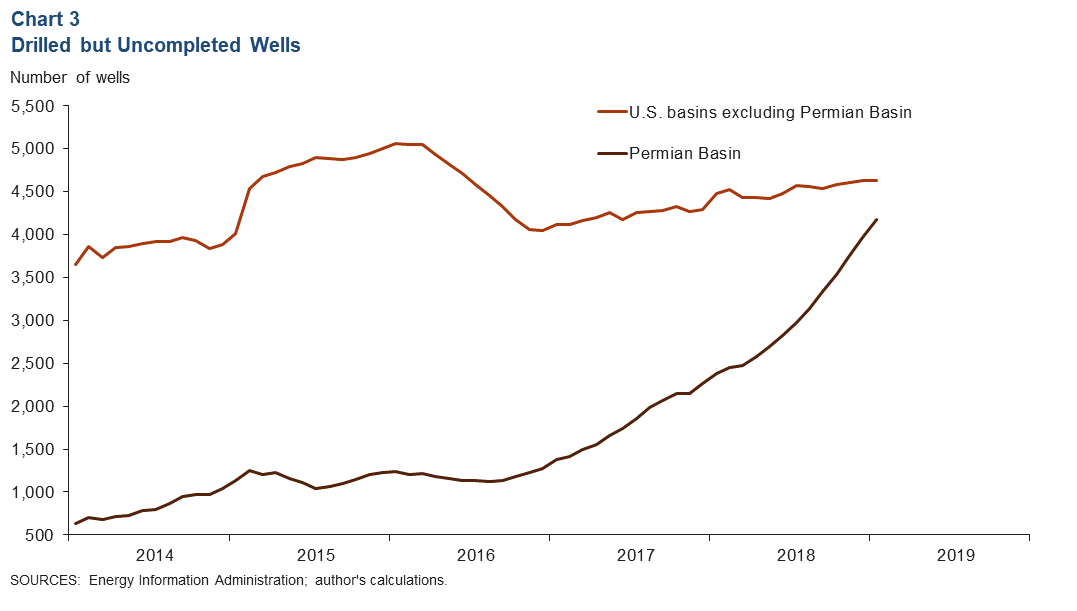
Drilled but Uncompleted Wells Rise Steadily
The Permian’s number of drilled but uncompleted wells (DUCs) continued to rise in January, totaling 4,170—up 5.2 percent from December 2018 (Chart 3). DUCs outside of the Permian advanced at a much slower pace. The Permian Basin now contains just under half of the total DUCs in the U.S.
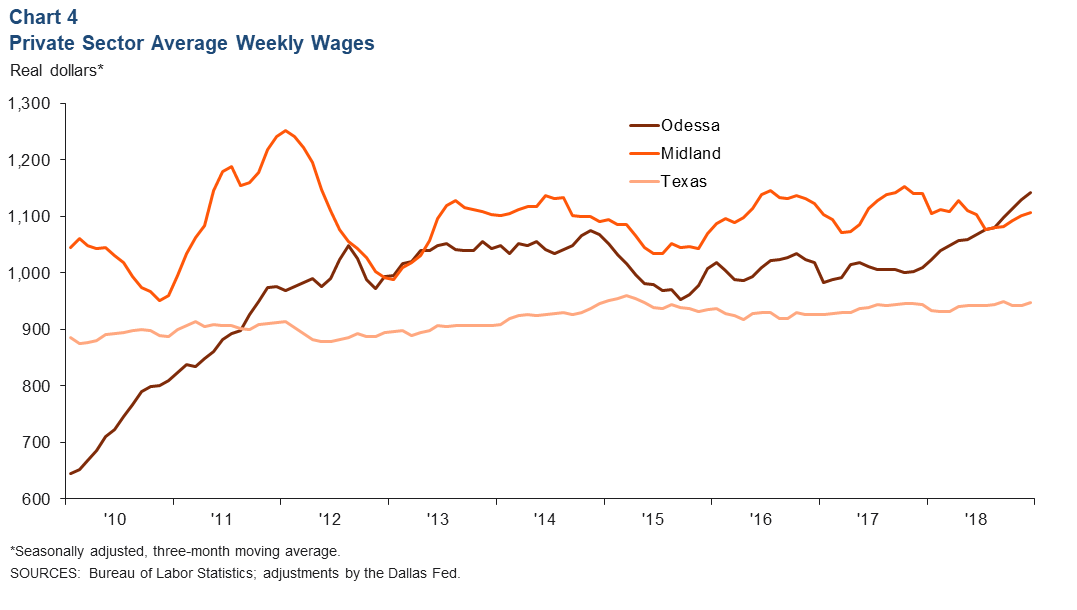
Average Weekly Wages
Odessa private sector average weekly wages were $1,141 in December 2018, rising to their highest level since 2007 and surpassing Midland’s figure of $1,106 (Chart 4). Odessa wages rose 13 percent in 2018, compared with a 3 percent decline in Midland earnings and a 0.4 percent increase in Texas wages.
Housing
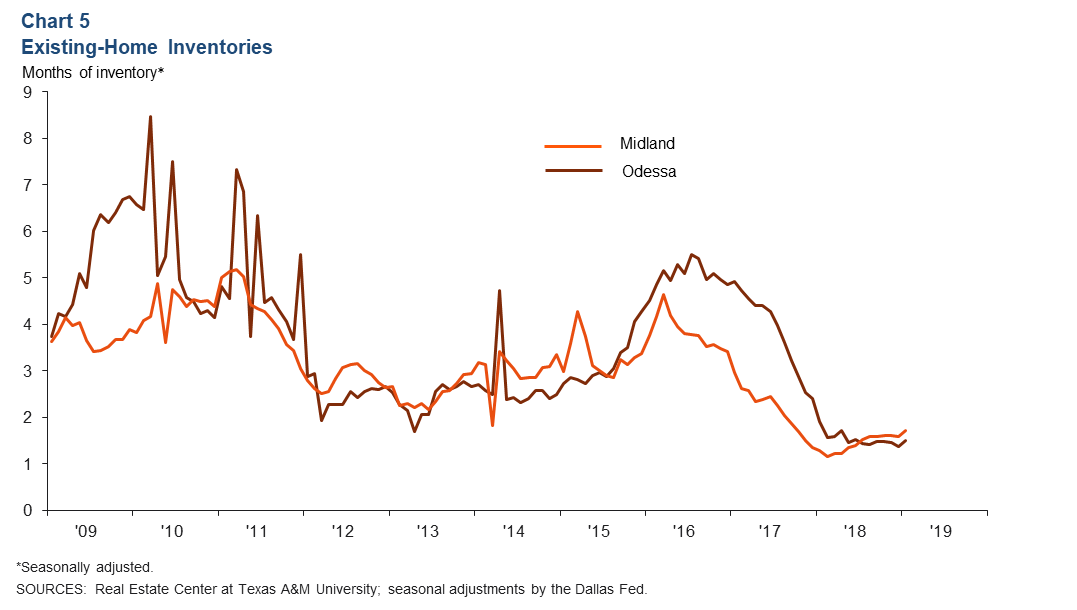
Housing Market Tight
Permian Basin home inventories remain tight. In January, Odessa’s months of inventory stood at 1.6, below Midland’s 1.7 months and well below Texas’ 3.5 months (Chart 5). Inventories in the Permian Basin have been below two months since February 2018.
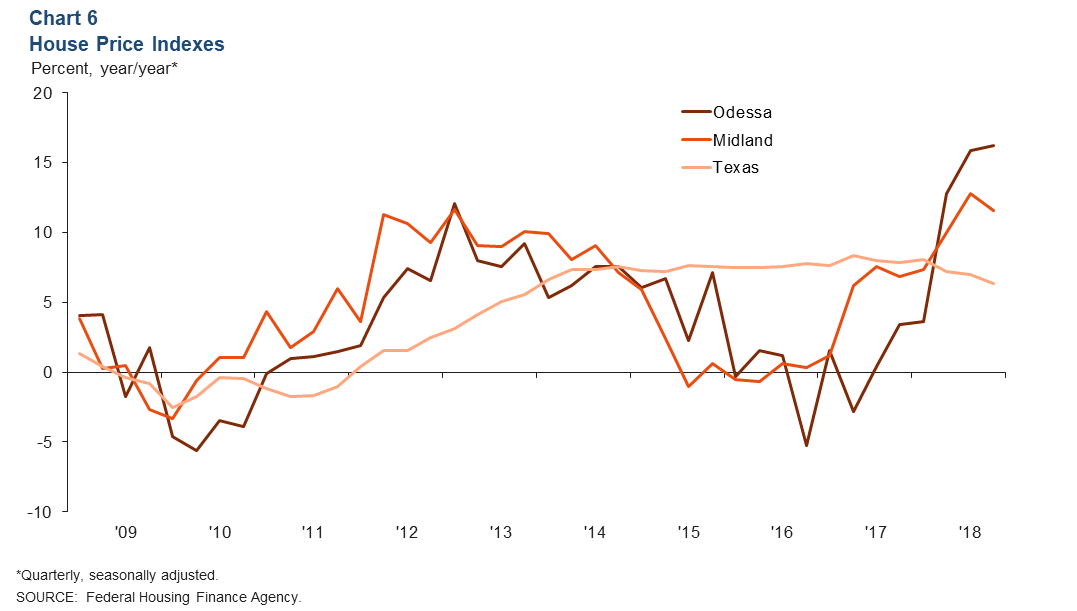
Home Prices Rising
Home prices continue to climb as inventories remain tight. In fourth quarter 2018, Odessa home prices jumped 16.2 percent from a year earlier, and Midland prices rose 11.6 percent over the same period (Chart 6). Home-price gains in the Permian are well above the state’s 6.3 percent increase in 2018.
NOTES: Data are for the Midland–Odessa metropolitan statistical area (Martin, Midland and Ector counties), except for energy data, which cover the 55 counties in West Texas and southern New Mexico that make up the Permian Basin region. Data may not match previously published numbers due to revisions.
About Permian Basin Economic Indicators
Questions can be addressed to Marycruz De Leon at Marycruz.DeLeon@dal.frb.org. Permian Basin Economic Indicators is released on the third Wednesday of every month.