Permian Basin Economic Indicators

Permian Basin natural gas prices are starting to bounce back after falling to record lows in early April, and the number of drilled but uncompleted wells is rising. Total nonfarm employment fell from January to February, partly due to a decrease in the mining, logging and construction sector. Home prices continue to rise in the Permian despite a mild drop in Midland’s housing sales.
Energy
Midland Natural Gas Prices
Waha Hub’s end-of-week closing price, a marker for natural gas prices in West Texas, ended the week of April 12 at 40 cents per million British thermal units (MMBtu). This was a rise of $1.70 per MMBtu from the previous week, when prices at Waha hit a record low of -$1.30 (Chart 1). The low level resulted from pipeline capacity shortages exacerbated by a closure and falling seasonal demand.
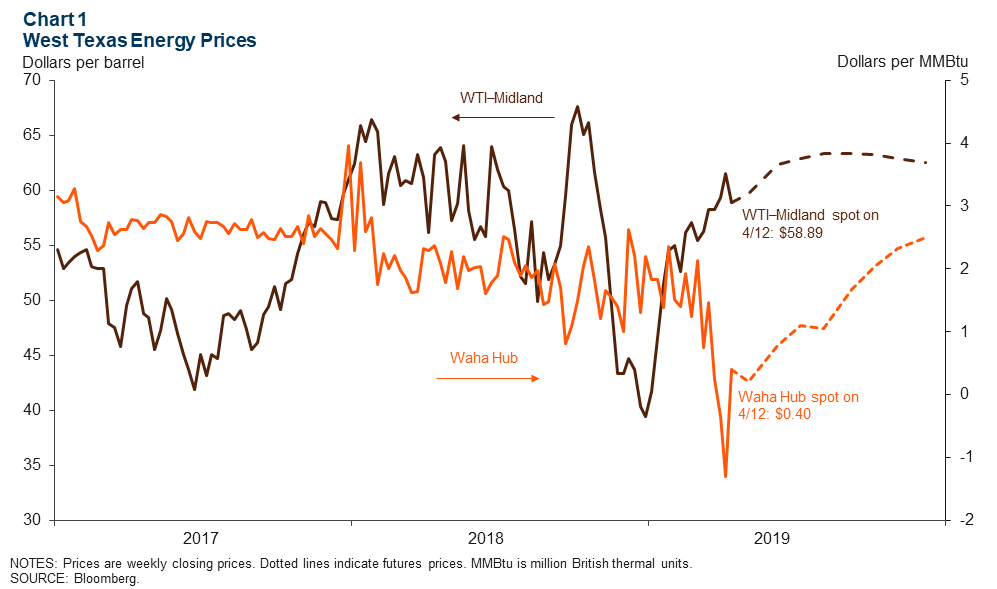
The weekly spot for West Texas Intermediate (WTI) crude oil priced in Midland closed at $58.89 per barrel on April 12, $5 below the price of WTI priced in Cushing. The Midland price was 62 cents higher than the previous month (closing weekly spot price for March 15).
Drilled but Uncompleted Wells Rise Steadily
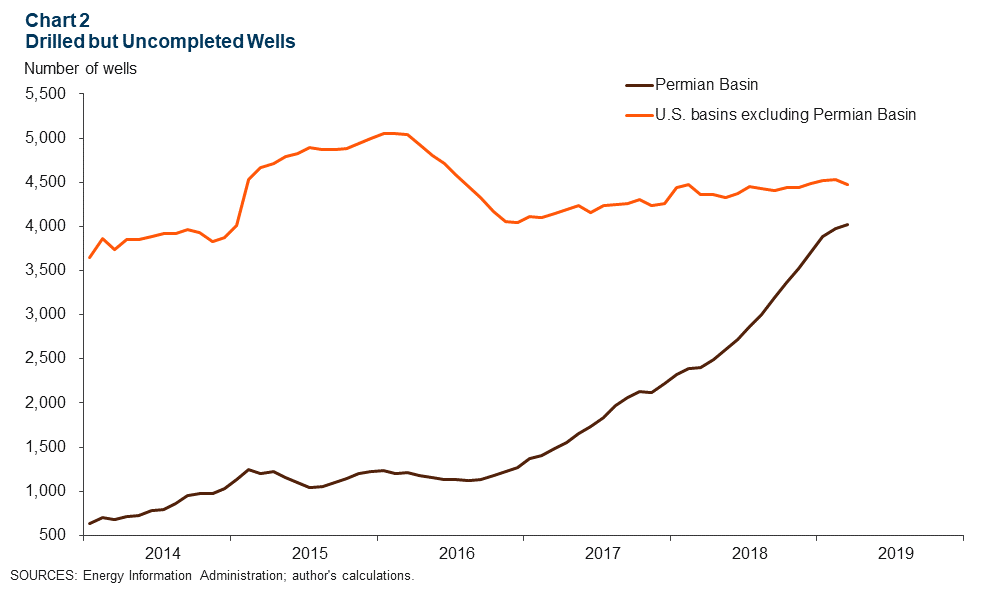
The number of drilled but uncompleted wells (DUCs) rose to 4,021 in the Permian Basin in March, a 1.2 percent increase from February (Chart 2). DUCs outside of the Permian decreased 1.2 percent over that time. The rise in DUCs in the Permian is not a new trend; since March 2018, Permian DUCs are up 67 percent versus a mere 2.7 percent elsewhere. As a result, just under half of all DUCs in the U.S. are now in the Permian Basin.
Rig Count Declines for Deeper Wells
The average number of rigs operating in the Permian Basin has been nearly flat, at close to 480, since May 2018 (Chart 3). Now, rigs for wells deeper than 10,000 feet are decreasing while rigs for shallower wells are increasing. Rigs for well depths between 10,000 and 15,000 feet, which make up over half of the active rigs in the Permian, fell from a monthly average of 266 rigs per week in March to 254 rigs in the first half of April—a 4.5 percent drop.
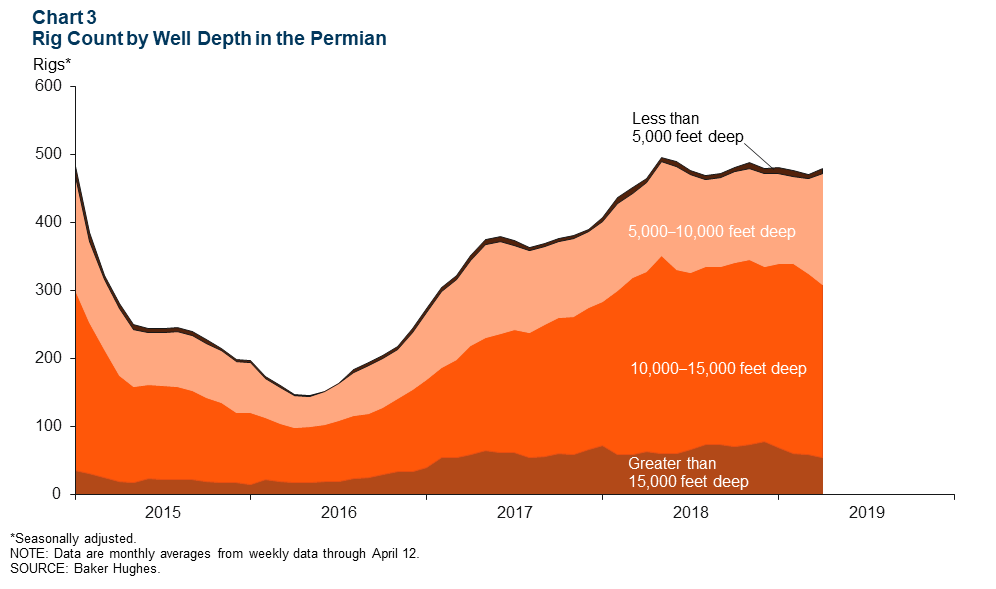
By comparison, rigs drilling to depths of 5,000 to 10,000 feet—over one-third of the total—increased by 18 percent. The number of rigs for wells deeper than 15,000 feet dropped by seven to 53 from March to April, while wells shallower than 5,000 feet remained unchanged.
Labor Market
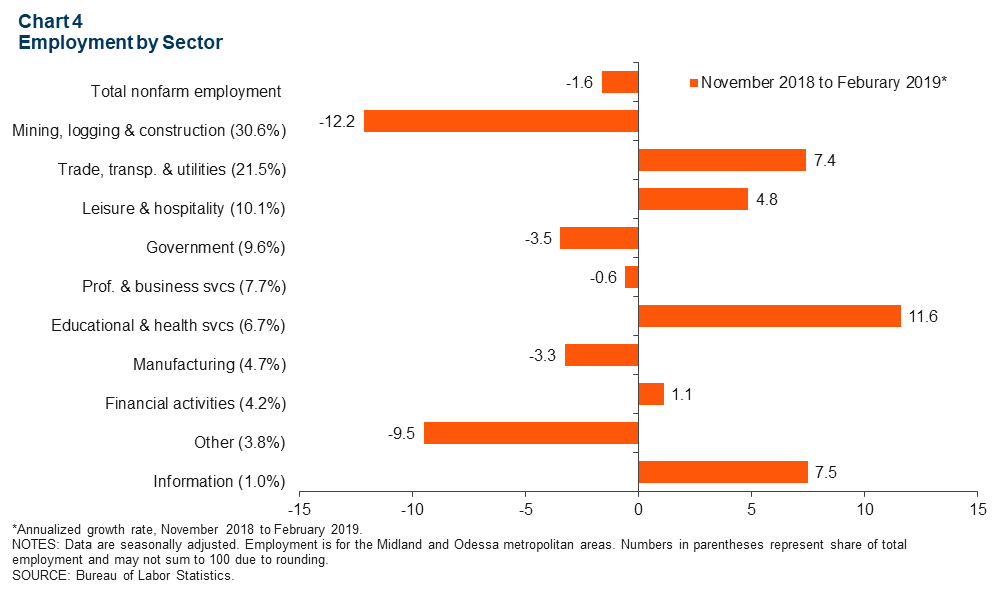
Total nonfarm employment fell to 192,000 in February, a three-month annualized drop of 1.6 percent (Chart 4). The mining, logging and construction sector, which makes up 30.6 percent of total employment, fell 12.2 percent. Trade, transportation and utilities, which makes up 21.5 percent of employment, increased by 7.4 percent. Educational and health services marked the fastest employment growth, an 11.6 percent increase.
Housing
Housing Prices Rise in Permian
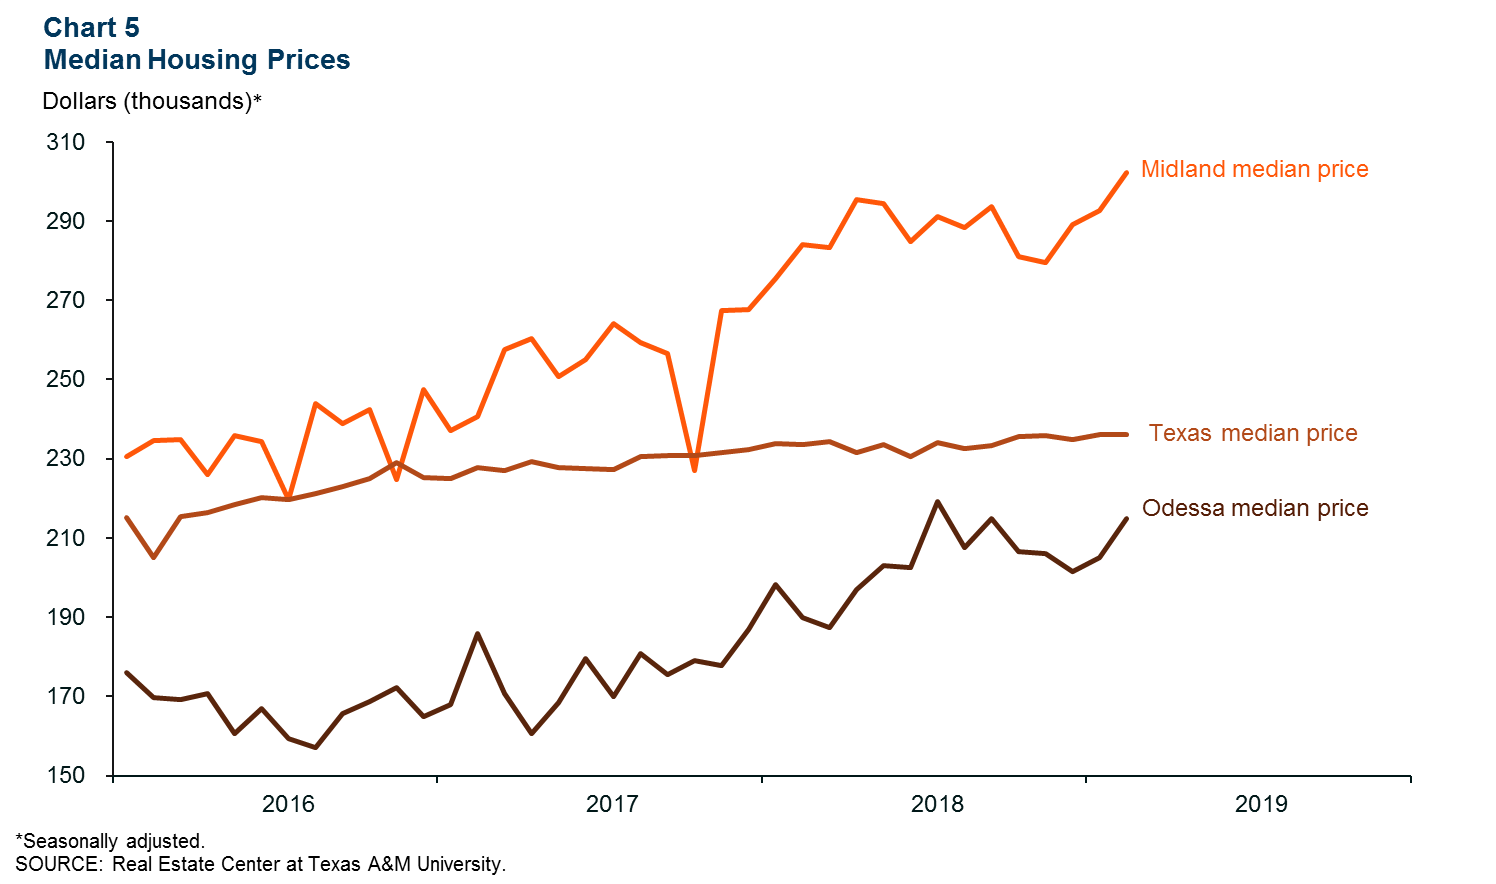
The median house price in Texas was flat from January to February at $236,000, while home prices increased in the Permian (Chart 5). In February, the median home price in Midland rose by $10,000 to $302,000, and the median price in Odessa rose to $214,800. Odessa saw faster growth during the month, with a 4.8 percent increase.
Home Trends Diverge
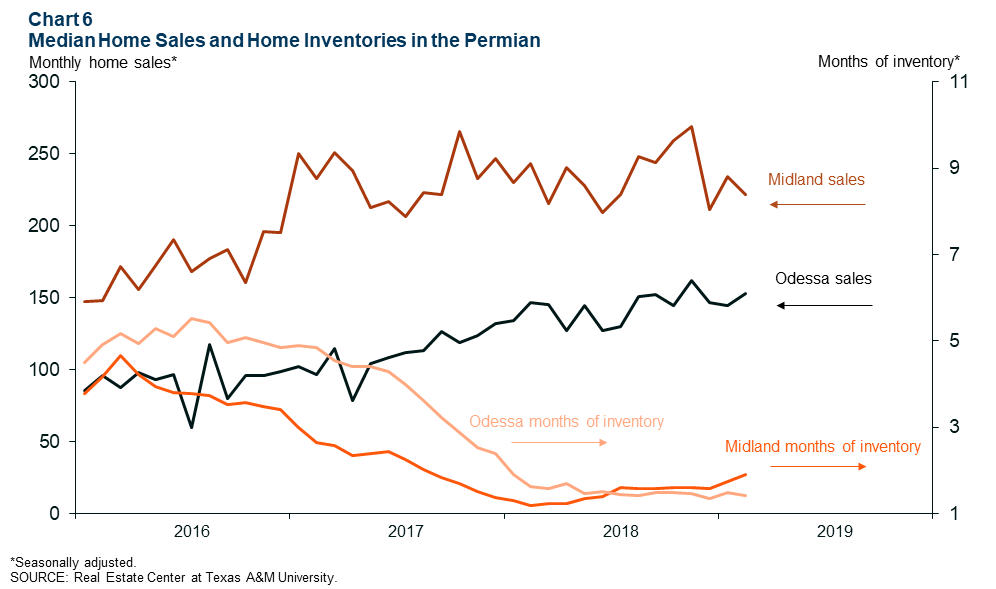
Growth in home inventories and sales diverged for Midland and Odessa in February (Chart 6). Midland’s home sales decreased to 221 homes from 234 in January, while Odessa’s increased 5.6 percent to 153 homes. Sales activity mirrors the changes in home inventories. Midland’s months of inventory increased from 1.7 to 1.9. Odessa’s home inventories dipped from 1.5 to 1.4 months in February. Inventories at these low levels indicate a tight housing market.
NOTES: Employment data are for the Midland–Odessa metropolitan statistical area (Martin, Midland and Ector counties), unless otherwise specified. Energy data includes the 55 counties in West Texas and southern New Mexico that make up the Permian Basin region. Data may not match previously published numbers due to revisions.
About Permian Basin Economic Indicators
Questions can be addressed to Emma Marshall at emma.marshall@dal.frb.org or Jesse Thompson at jesse.thompson@dal.frb.org. Permian Basin Economic Indicators is released monthly.