Permian Basin Economic Indicators

Permian Basin total nonfarm employment rose in June, partly due to an increase in the mining, logging and construction sector. The rig count continues to fall, while oil production reaches new highs, and the number of drilled but uncompleted wells continues to grow. Home prices rose further in the Permian despite a slight drop in housing sales.
Labor Market
Employment Picks Up
Employment growth in the Permian has been sluggish, with a three-month annualized increase of 0.5 percent in June (Chart 1). Gains were driven by a 5.7 percent increase in mining, logging and construction, which accounts for nearly one-third of all jobs. Mining employment has risen in anticipation of increased pipeline capacity in the second half of the year.
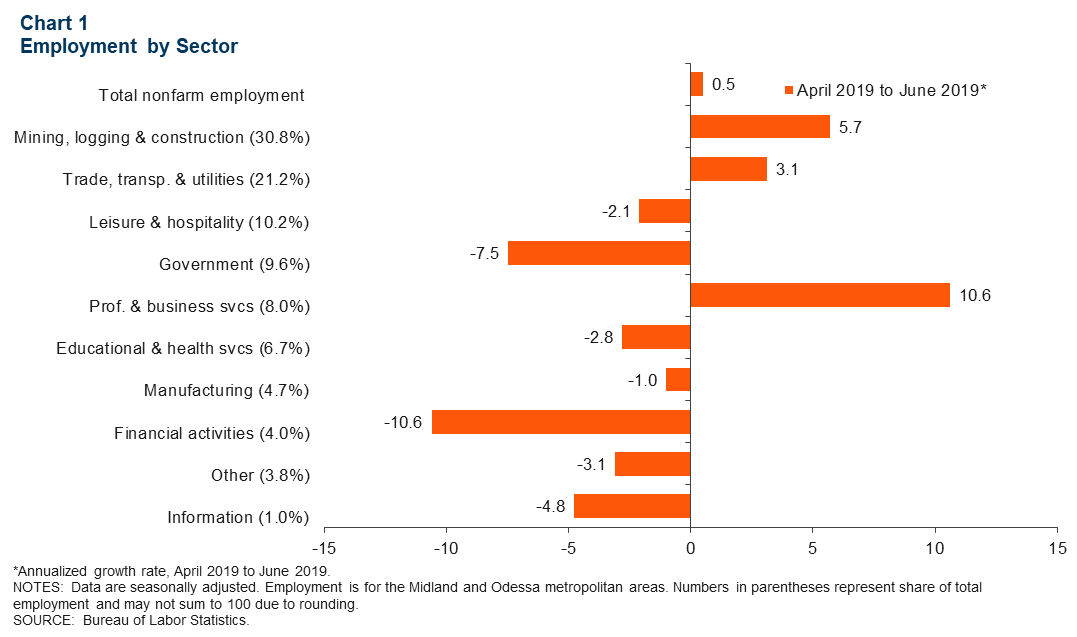
Trade, transportation and utilities, which accounts for 21.2 percent of jobs in the Permian, increased 3.1 percent over the three months ending in June. Meanwhile, leisure and hospitality, the third-largest sector, posted a three-month annualized decrease of 2.1 percent.
Unemployment Rate at Historical Lows
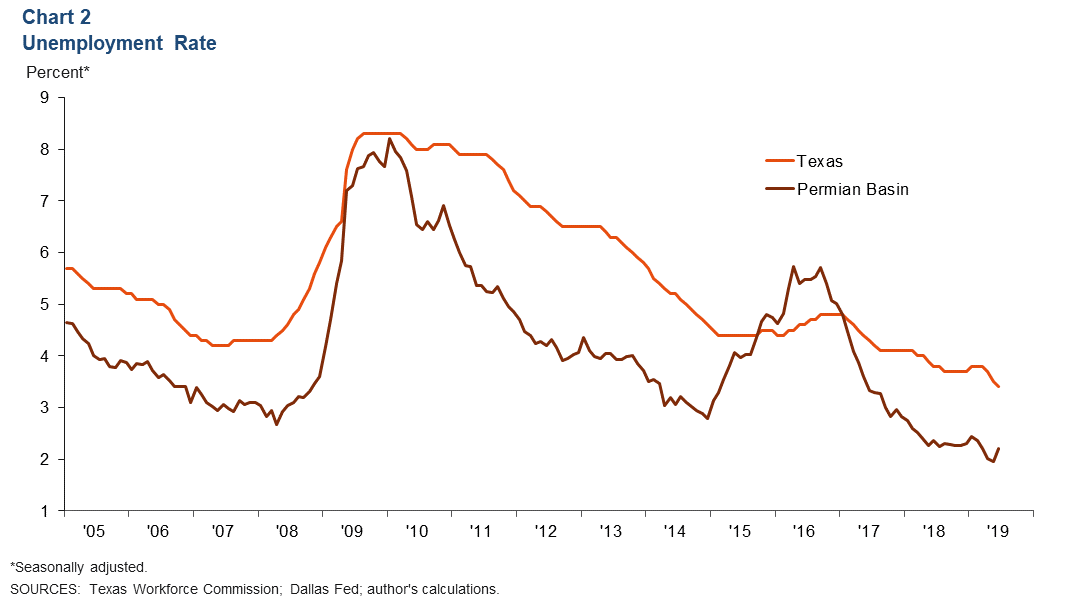
The Permian Basin unemployment rate ticked up to 2.2 percent in June (Chart 2). The jobless rate remains well below the Texas and U.S. rates of 3.4 percent and 3.7 percent, respectively.
Wages
Recently released occupational employment wage data from the Texas Workforce Commission show Midland had the highest wages among all Texas metros in 2018 (Chart 3). Midland’s average annual wages of $55,831 were also above the state’s average of $49,720. Meanwhile, Odessa’s average annual wages came in below the state average at $46,858.
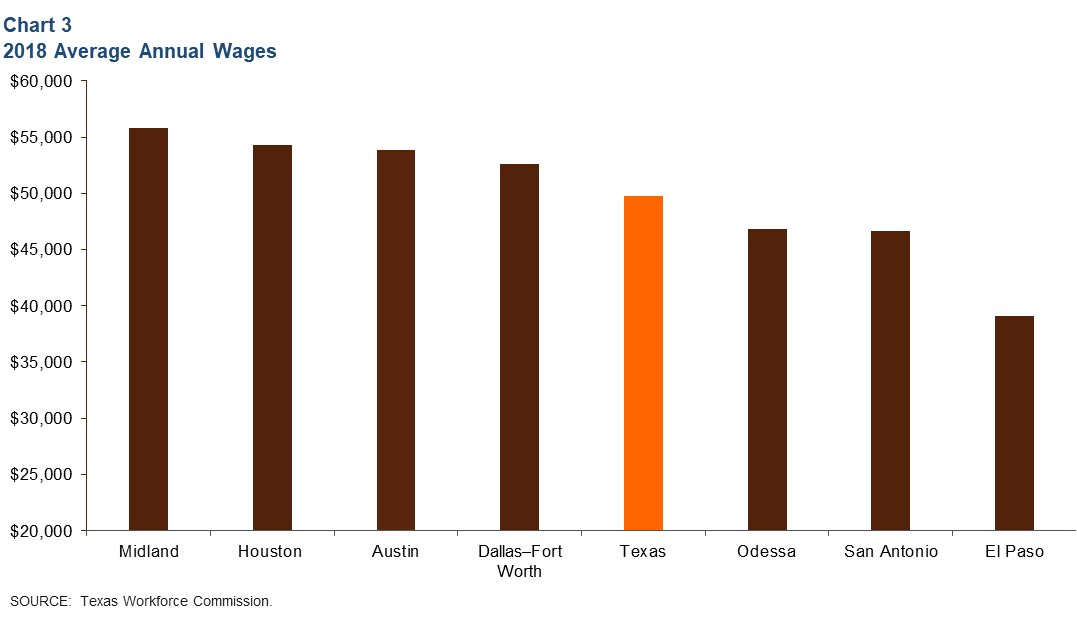
Not surprisingly, the highest-paying occupations in Midland are management occupations in the mining industry; in Odessa, management occupations in the manufacturing industry pay the most.
Energy
Oil Production Reaches New High; Rig Count Continues to Fall
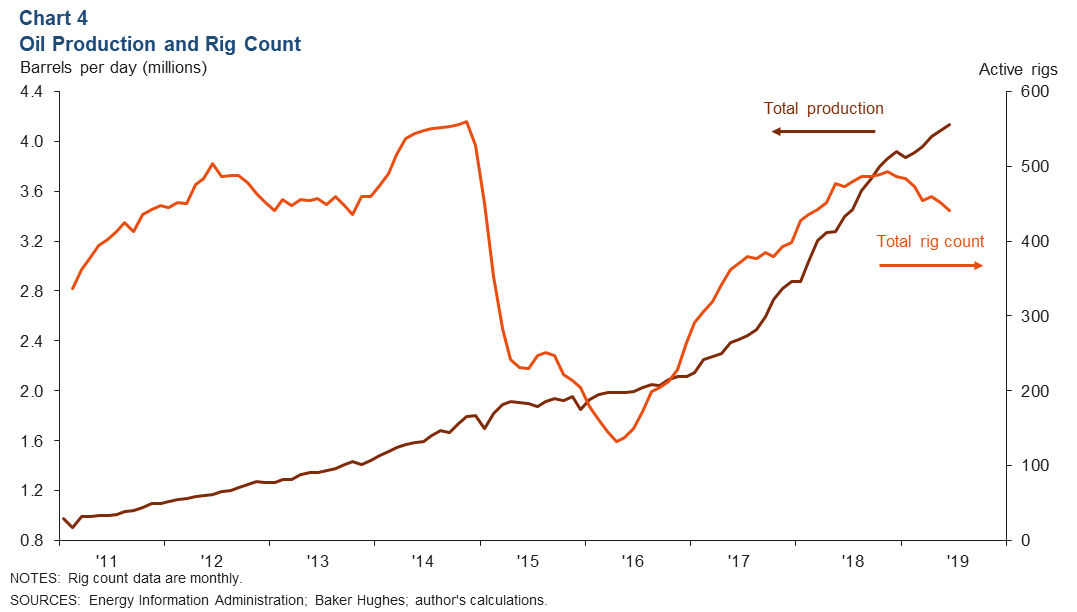
Permian Basin oil production is estimated to have reached 4.1 million barrels per day in June, up 21 percent from a year earlier (Chart 4). Meanwhile, the Permian rig count continues to decline and stood at 441 in June, down from 452 in May.
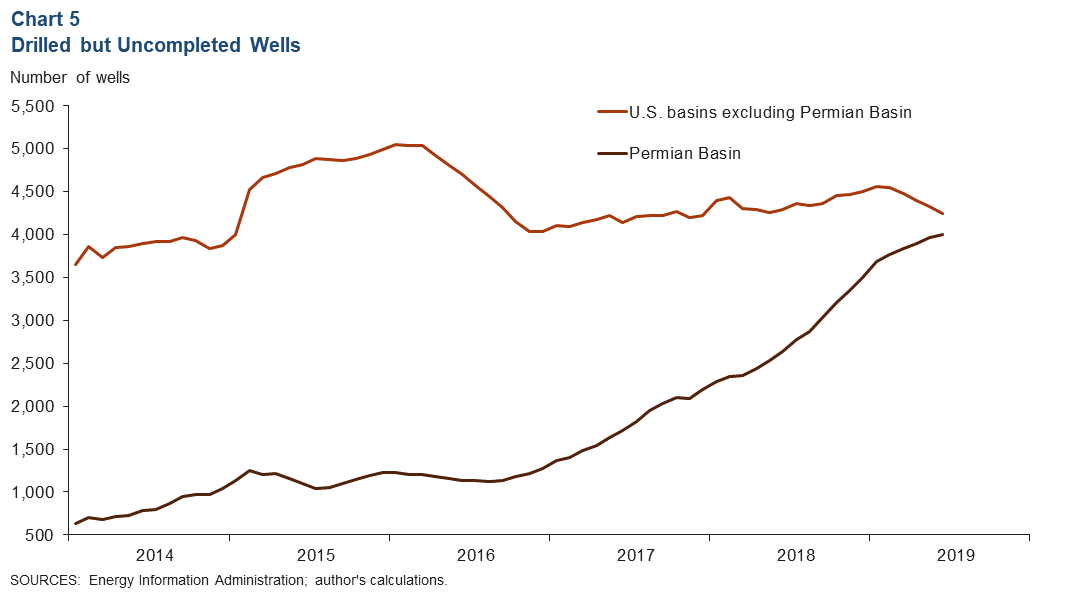
Drilled but Uncompleted Wells Rise Steadily
The number of drilled but uncompleted wells (DUCs) rose to over 4,000 in the Permian Basin in June, a 1.1 percent increase from May (Chart 5). Meanwhile, DUCs outside of the Permian decreased 1.9 percent over that time. Since June 2018, Permian DUCs are up 52.0 percent versus a 1.0 percent decline elsewhere. The increase in Permian DUCs may be linked to the pipeline capacity that is expected to come online soon.
Housing
Existing-home prices continue to climb and reached new highs in May. The median home price in the Permian was $298,972, up 6.3 percent from a year earlier (Chart 6). Meanwhile, home sales have leveled off. After reaching a peak of 393 homes sold in April, sales inched down to 381 in May.
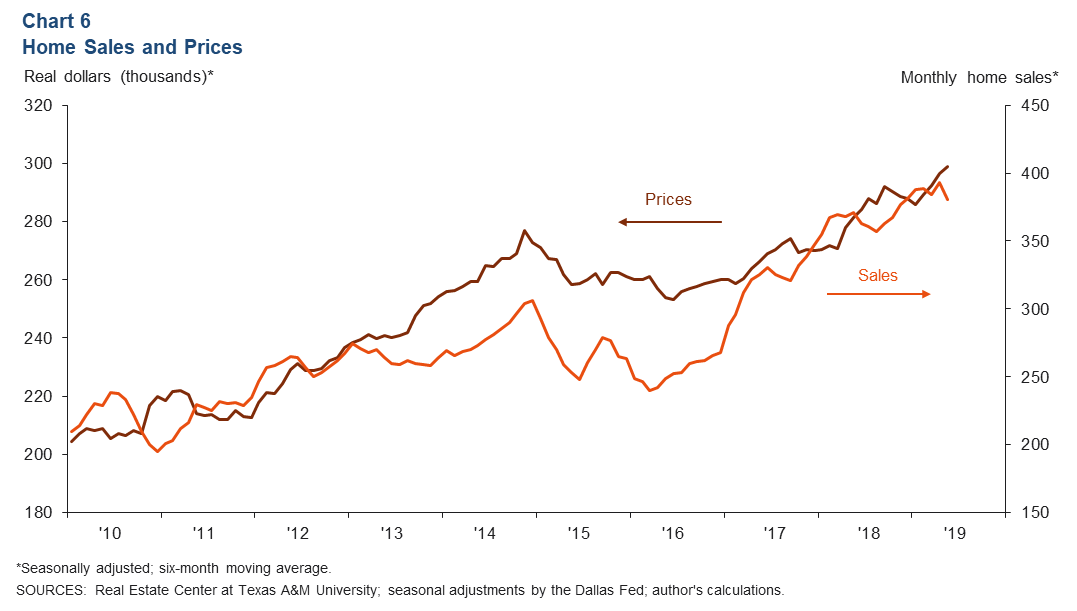
Existing-homes inventory remains tight. Through May, inventory has remained below two months in both Midland and Odessa. In May, Midland’s supply stood at 1.9 months, while Odessa’s was 1.3 months.
NOTES: Employment data are for the Midland–Odessa metropolitan statistical area (Martin, Midland and Ector counties), unless otherwise specified. Energy data includes the 55 counties in West Texas and southern New Mexico that make up the Permian Basin region. Data may not match previously published numbers due to revisions.
About Permian Basin Economic Indicators
Questions can be addressed to Marycruz De León at marycruz.deleon@dal.frb.org. Permian Basin Economic Indicators is released monthly.