Permian Basin Economic Indicators

December 19, 2019
The Permian Basin rig count continued to contract in November, while oil prices ticked up in December. Midland wages edged up in October, but Odessa wages declined. Housing inventories picked up in both Midland and Odessa, while home price gains slowed in both metros.
Energy
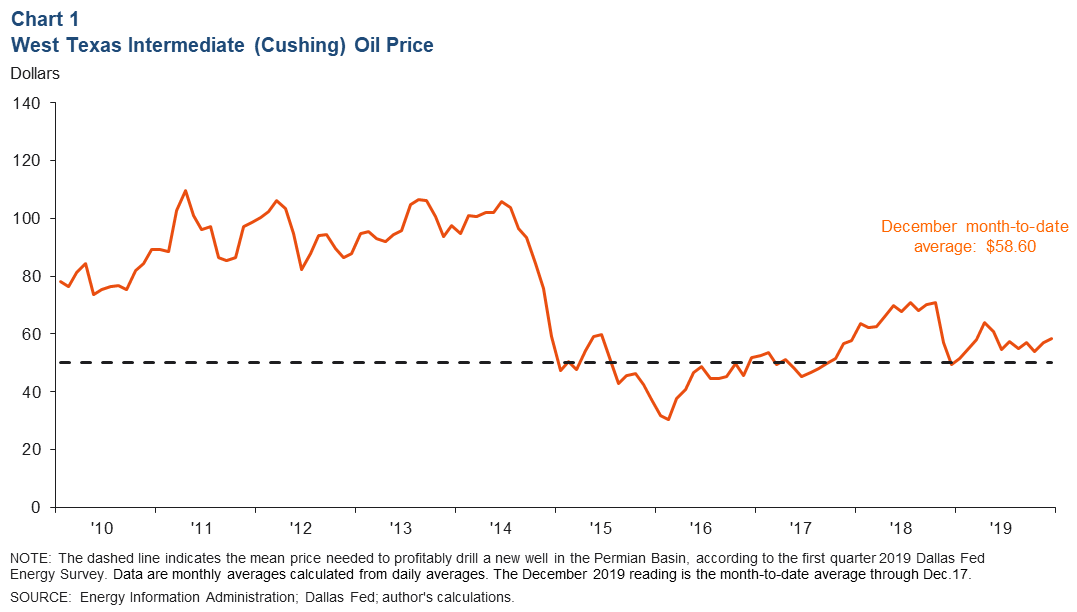
Oil Prices Tick Up
The recent announcement by OPEC and a few other nations to deepen supply cuts caused West Texas Intermediate (WTI) crude priced in Cushing, Oklahoma, to rise modestly. December month-to-date WTI averaged $58.60 per barrel, above November’s average of $56.97 (Chart 1).
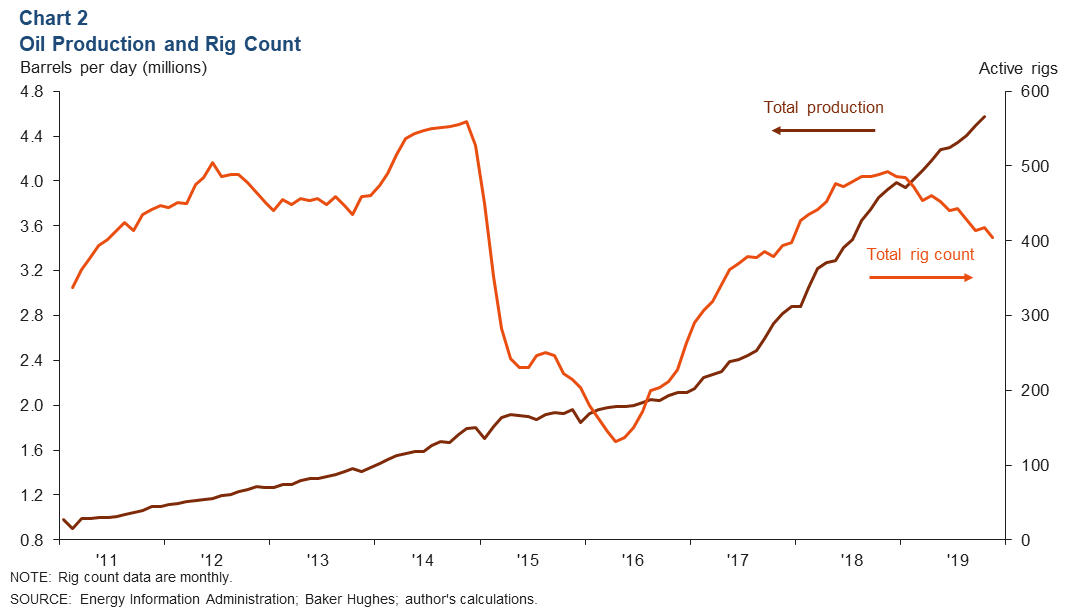
Rig Count Contracts, Oil Production Climbs
The Permian rig count has been trending down since November 2018, falling by 89 rigs to 404 in November 2019 (Chart 2). Meanwhile, production continues to climb and reached 4.57 million barrels per day in October.
Labor Market
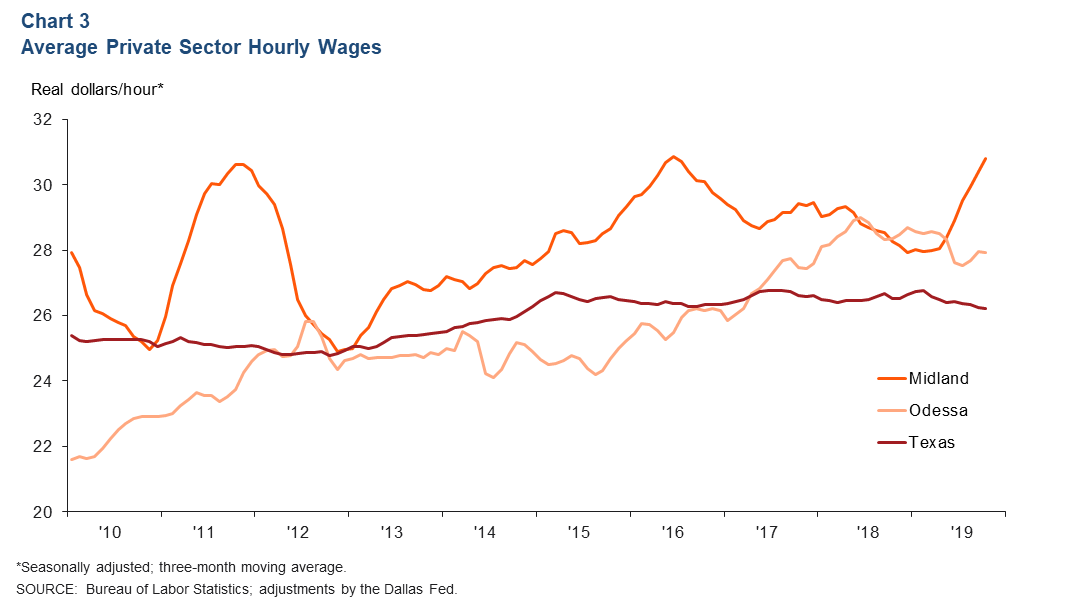
While Permian Basin job growth has been sluggish this year, the three-month average for private sector hourly wages in Midland continues to climb (Chart 3). The average in Midland stood at $30.82 in October, up 9.0 percent from a year ago. The average in Odessa fell 1.5 percent from the prior year to $27.94. In October, both the Midland and Odessa averages were above the Texas average of $26.20.
Housing
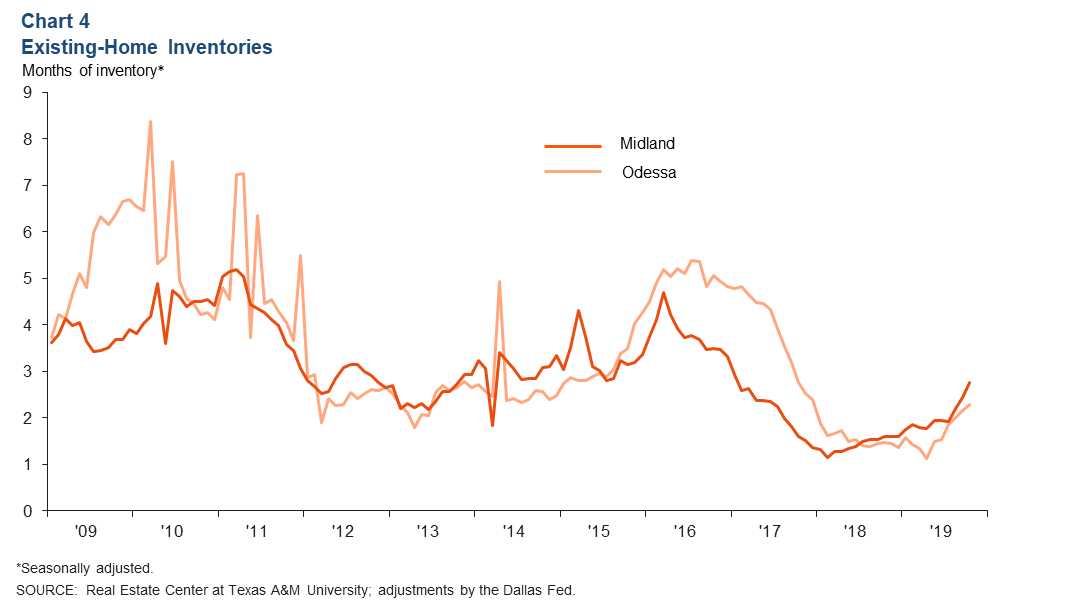
Inventories Rise
Home inventories in Midland and Odessa have been rising over recent months (Chart 4). In Odessa, inventories have been climbing since hitting an April 2019 low of 1.3 months and stood at 2.2 months in October. In Midland, inventories were at 2.5 months, up from a low of 1.2 months in April 2018. Despite the gains, inventories in both markets remain well below the six months considered a balanced market.
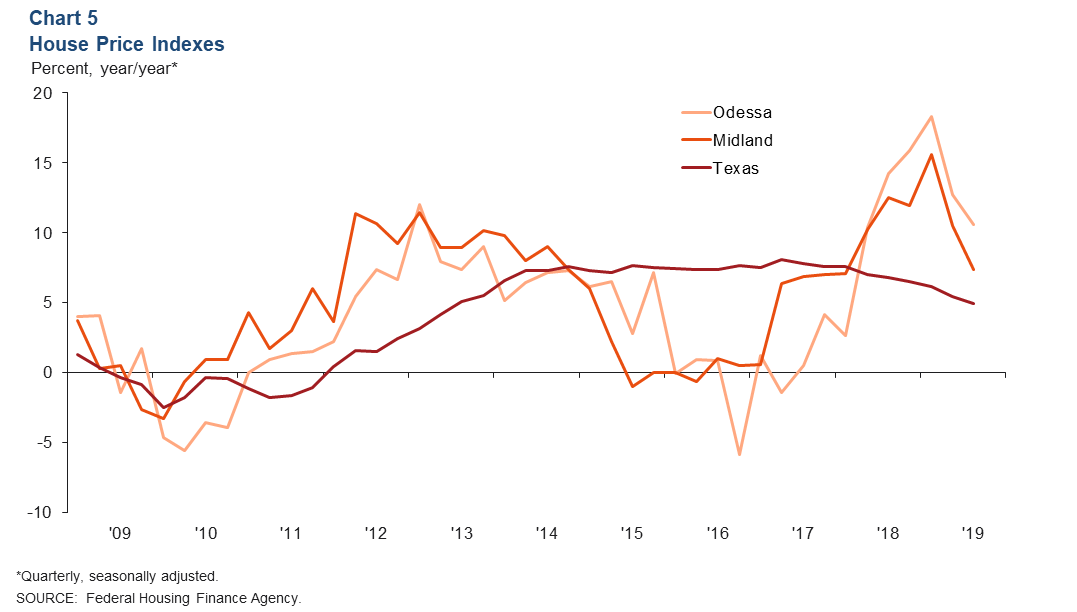
Home Price Gains Slow
The housing shortage experienced in the Permian over the past couple of years has caused home prices to soar. However, as inventories build, home price gains are slowing. In third quarter 2019, Odessa home prices rose 10.5 percent from a year earlier, lower than the 18.3 percent increase in first quarter 2019 (Chart 5). Midland prices rose 7.4 percent over the same period, below the 15.6 percent increase in the first quarter. Home price gains in Texas are also slowing. In the third quarter, the state posted a 4.9 percent year-over-year increase in home prices.
Bank Lending
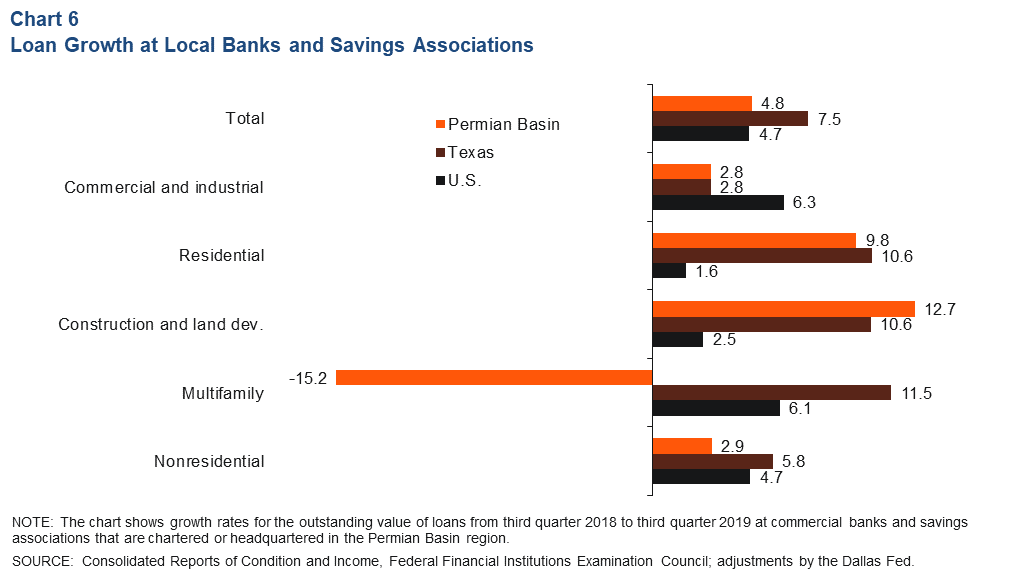
While the Permian Basin led the state in loan growth in 2018, data through third quarter 2019 show loan growth at the 63 banks and savings associations chartered or headquartered in the region now lags the state (Chart 6). Year-over-year loan growth in the Permian Basin stood at 4.8 percent, below the state’s 7.5 percent in the quarter. However, the outstanding value of construction and land development loans was up 12.7 percent, compared with 10.6 percent in Texas.
NOTES: Employment data are for the Midland–Odessa metropolitan statistical area (Martin, Midland and Ector counties), unless otherwise specified. Energy data include the 55 counties in West Texas and southern New Mexico that make up the Permian Basin region. Data may not match previously published numbers due to revisions.
About Permian Basin Economic Indicators
Questions can be addressed to Marycruz De León at marycruz.deleon@dal.frb.org. Permian Basin Economic Indicators is released monthly.