Permian Basin Economic Indicators

| Midland–Odessa economy dashboard (third quarter 2024) | |||||
| Job growth (annualized) June–Sept. '24 |
Avg. unemployment rate |
Avg. hourly earnings | Avg. hourly earnings growth y/y | ||
| Midland–Odessa | -1.0% | 2.9% | $34.39 | 3.7% | |
| Midland | -0.7% | 2.6% | $36.44 | 4.0% | |
| Odessa | -1.2% | 3.4% | $31.32 | 3.4% | |
Employment in the Permian Basin region contracted in the third quarter. The unemployment rate and average hourly earnings ticked down slightly in September. Oil prices declined in the third quarter, while oil production rose despite a decline in the rig count. Home prices decreased in the Midland−Odessa region in September, while home sales increased.
Energy
Crude oil prices fall
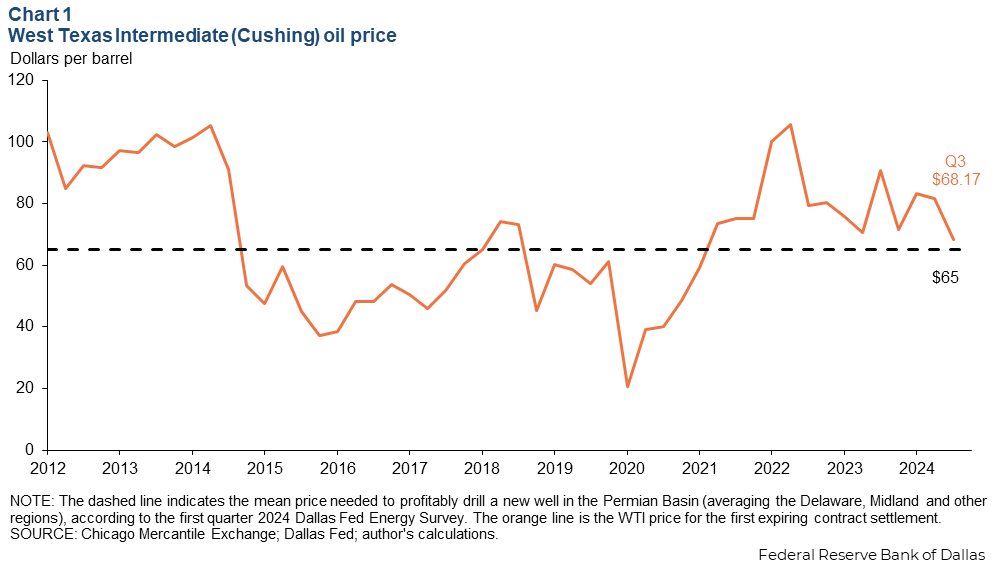
The average price of West Texas Intermediate (WTI) crude oil decreased to $68 per barrel in the third quarter, a 16.4 percent drop from the second quarter (Chart 1). Global oil demand concerns and uncertainty about then-planned OPEC+ supply increases (which were ultimately delayed to January) contributed to the decline in oil prices. These factors outweighed geopolitical risks as conflict continues in the Middle East and Ukraine.
Oil production grows with fewer rigs
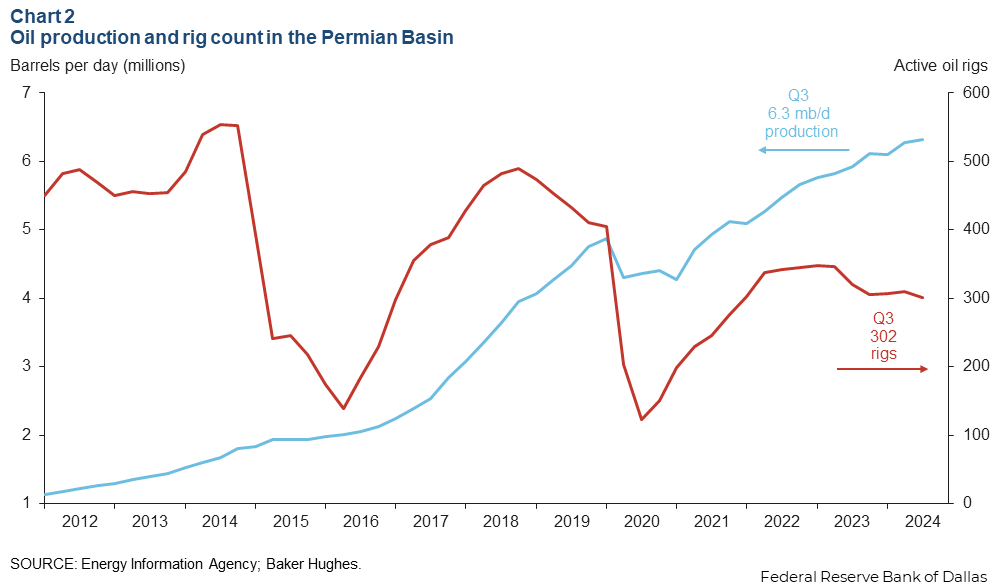
Oil production in the Permian Basin rose to a record 6.3 million barrels per day (mb/d) in the third quarter. That’s 47 percent of all U.S. crude and condensate production or about 7.8 percent of global crude supply. The rig count of 302 in the Permian Basin is the lowest since the fourth quarter of 2021 and is 6 percent lower than the third quarter of 2023 (Chart 2). Despite easing oilfield activity, increases in production efficiency have allowed oil output to rise 0.4 mb/d, a 6.8 percent increase compared to the third quarter of 2023.
Labor market
Midland-Odessa employment falls
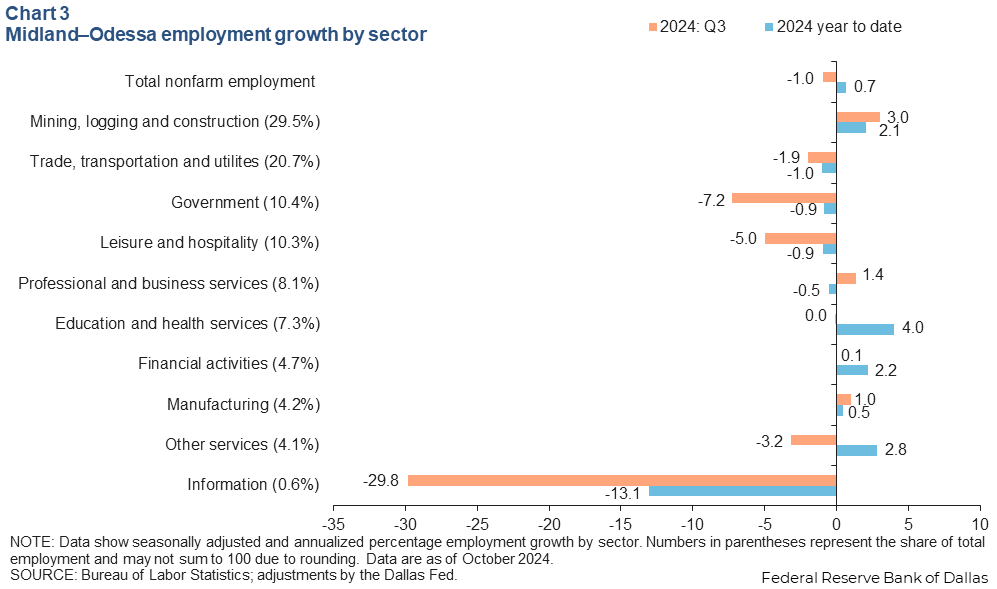
Total nonfarm employment contracted 1.0 percent (annualized) in the third quarter. At the same time, employment increased in the third quarter for both the U.S. (1.1 percent ) and Texas (2.9 percent). Thus far in 2024, nonfarm employment in Midland–Odessa grew an annualized 0.7 percent, slower thanTexas (2.3 percent) and the U.S. (1.3 percent) (Chart 3).
Unemployment declines slightly
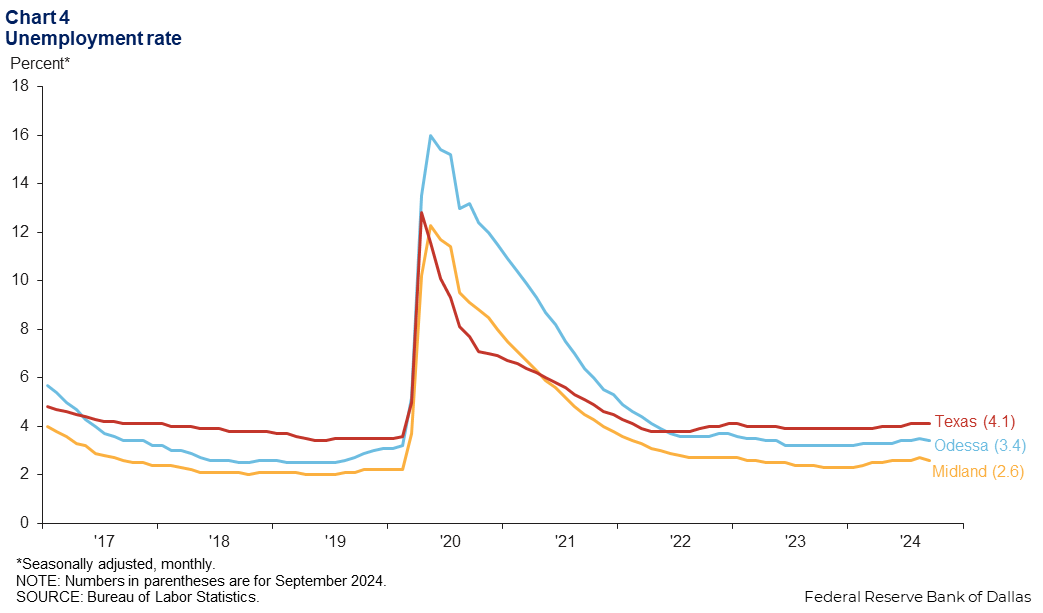
The unemployment rate declined slightly in September to 2.6 percent in Midland and to 3.4 percent in Odessa (Chart 4). Unemployment in both metro areas was lower than the jobless rate of 4.1 percent for Texas and the U.S.
Hourly earnings decrease
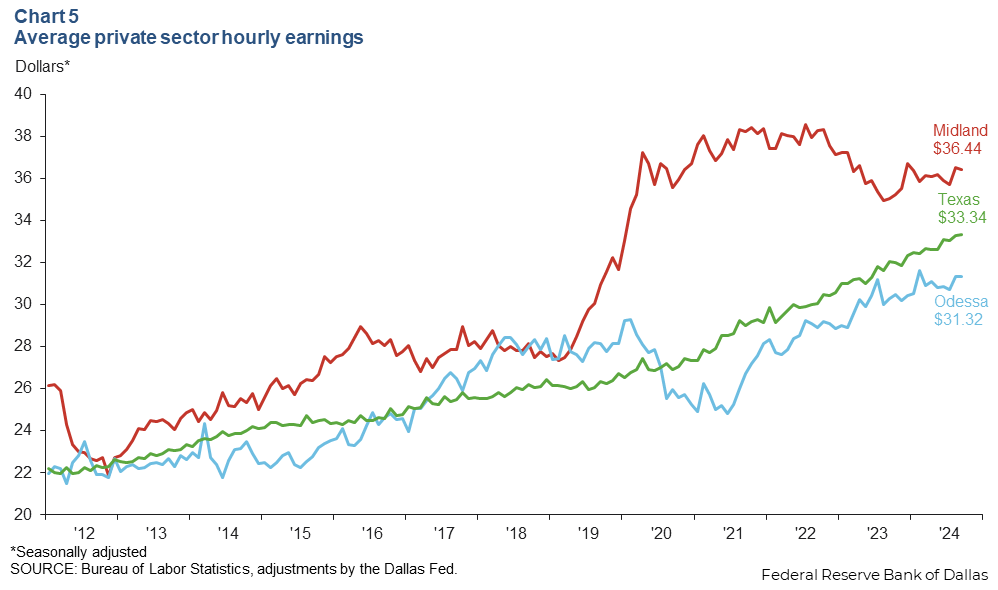
Average hourly earnings decreased slightly to $36.44 in Midland and $31.32 in Odessa in September (Chart 5). Hourly earnings in Odessa rose 3.4 percent year over year, lagging increases in Midland at 4.0 percent and Texas at 4.1 percent.
Housing
Home sales increase
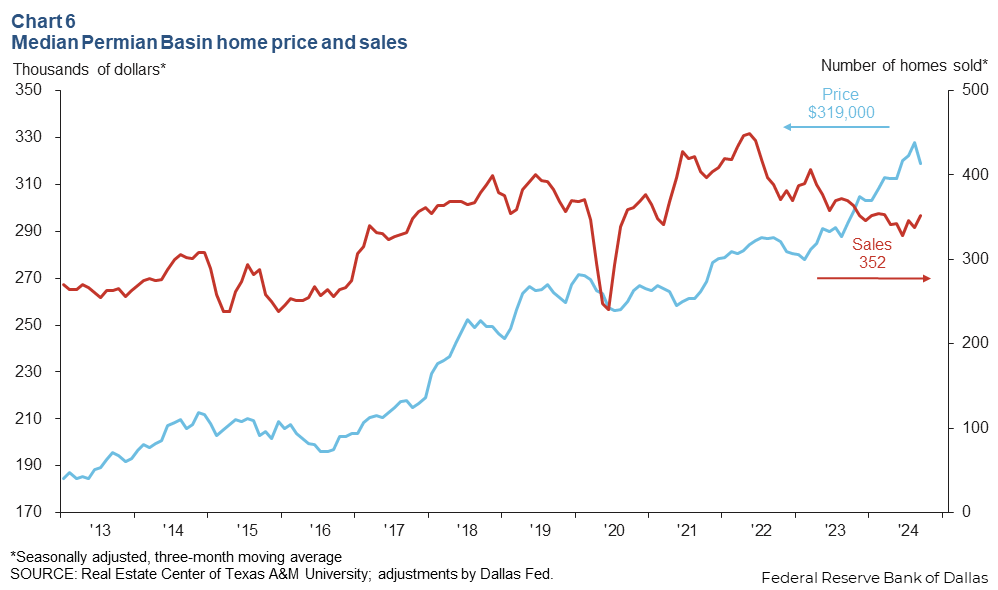
Home sales increased 4.1 percent in September. The median price of homes sold in the region fell 2.7 percent to $319,000 (Chart 6). This is slightly lower than Texas’ median home price of $337,000. Still, prices in the region are up 8.7 percent year over year while home sales are down 4.8 percent.
NOTES: Employment data are for the Midland–Odessa metropolitan statistical area (Martin, Midland and Ector counties), unless otherwise specified. Energy data include the 55 counties in West Texas and southern New Mexico that make up the Permian Basin region. Data may not match previously published numbers due to revisions.
About Permian Basin Economic Indicators
Questions or suggestions can be addressed to Vaughn Hajra at vaughn.hajra@dal.frb.org. Permian Basin Economic Indicators is released quarterly.