Permian Basin Economic Indicators

| Midland–Odessa economy dashboard (June 2025) | |||||
| Job growth (annualized) March '25–June '25 |
Unemployment rate |
Avg. hourly earnings | Avg. hourly earnings growth y/y | ||
| Midland–Odessa | 2.5% | 3.0% | $37.23 | 9.9% | |
| Midland | 3.9% | 2.8% | $38.69 | 7.7% | |
| Odessa | 0.5% | 3.3% | $35.01 | 13.7% | |
Employment in the Permian Basin grew in the second quarter. Meanwhile, the unemployment rate in the region decreased slightly from the first quarter 2025. Home sales increased, while the median price of homes sold was flat. Oil production remained stable, although the number of new wells and the number of active rigs ticked down.
Energy
Natural gas prices in Permian Basin rise slightly in the second quarter
Natural gas prices in the Permian Basin (Waha) rose slightly while national benchmark natural gas prices (Henry Hub) dipped in the second quarter (Chart 1). Henry Hub’s average price decreased from $24.03 per barrel of oil equivalent (BOE) to $18.51 in the second quarter, while Waha, the hub in West Texas close to the producing wells of the Permian Basin, increased from $10.27 per BOE to $11.43 in the same period.
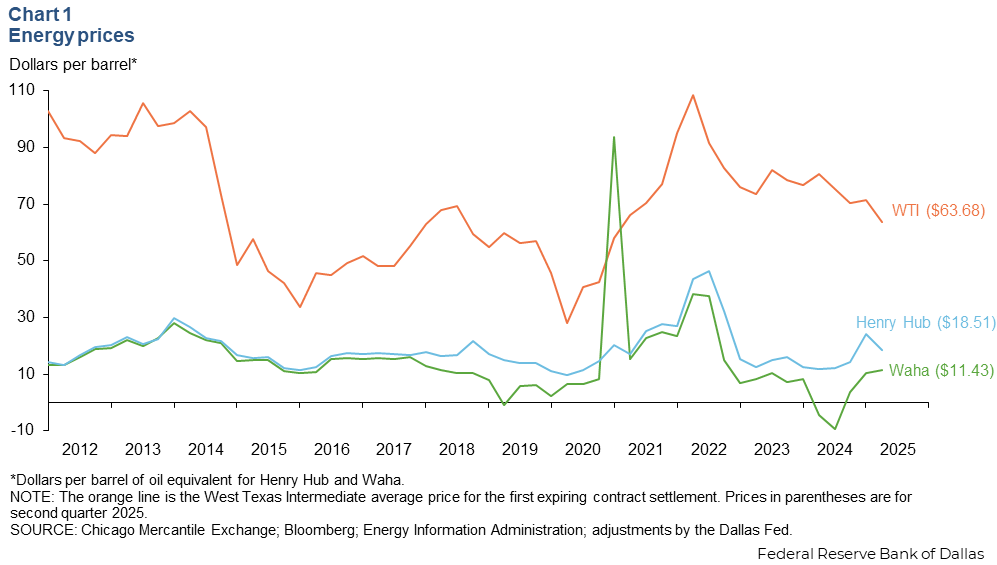
The price of West Texas Intermediate crude averaged $63.68 per barrel in the second quarter, a 10.8 percent decrease from the first quarter. However, prices rose to a daily average of $67.24 in July. This came after trade tensions eased, likely putting upward pressure on expectations of growth in global oil consumption.
Oil production increases in the Permian
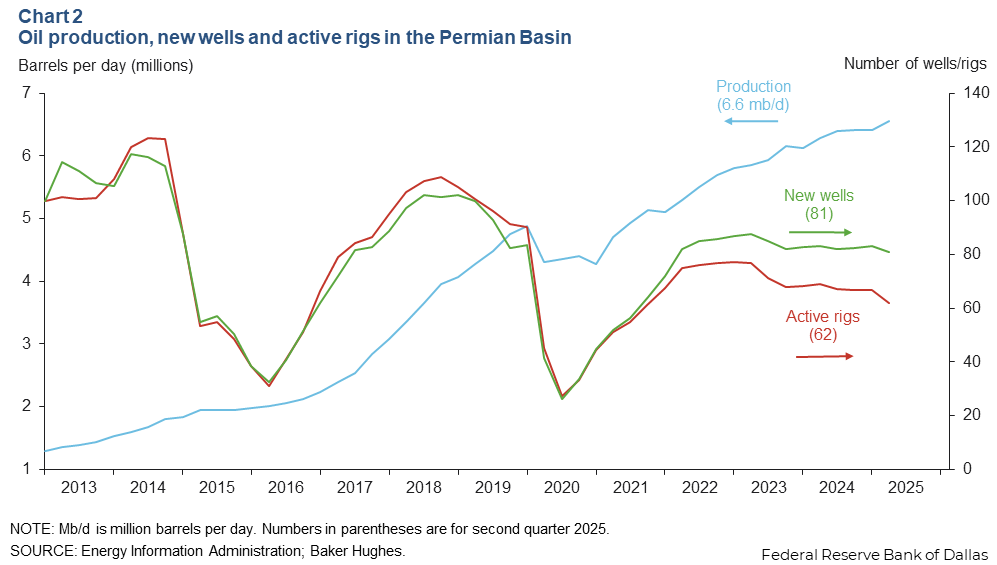
Oil production in the Permian Basin rose to 6.6 million barrels per day in the second quarter (Chart 2). However, the number of new wells drilled decreased 2.8 percent from the first quarter, and the number of active rigs decreased 6.9 percent over the same period. This was a continuation of steady improvements in drilling efficiency and well productivity allowing output to rise despite a drop in the number of active rigs and new wells.
Labor market
Employment expands in Midland–Odessa region
Total non-farm employment grew an annualized 2.5 percent in the second quarter (Chart 3 ). Second-quarter employment growth outpaced the U.S. (1.1 percent) and Texas (1.6 percent). The education and health services sector added the most jobs in the second quarter, followed by government. The information and other services sector contracted notably by 7.6 percent.
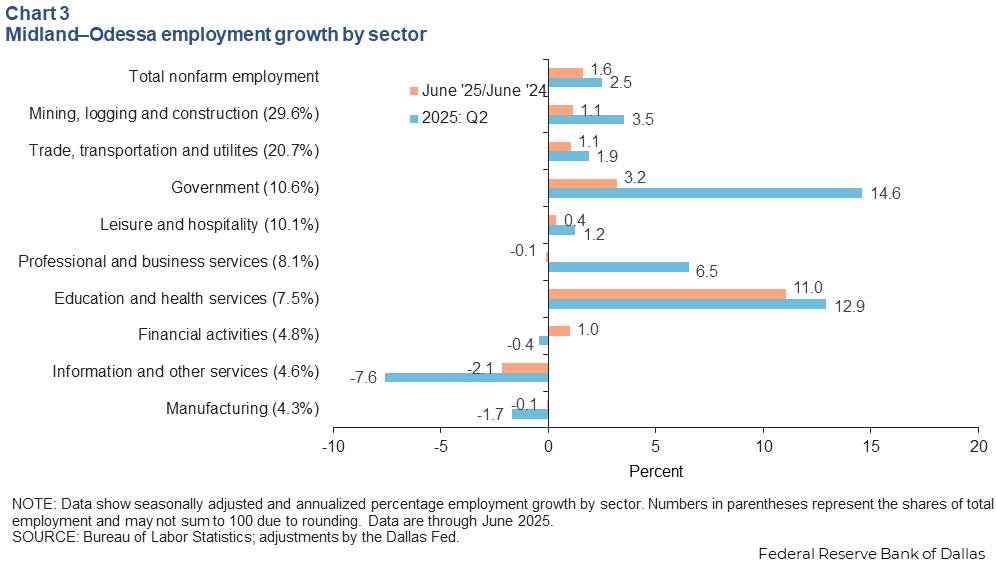
Year over year, employment in Midland–Odessa grew 1.6 percent. Employment in all sectors except for manufacturing, information and other services, and professional and business services increased.
Unemployment rates tick down
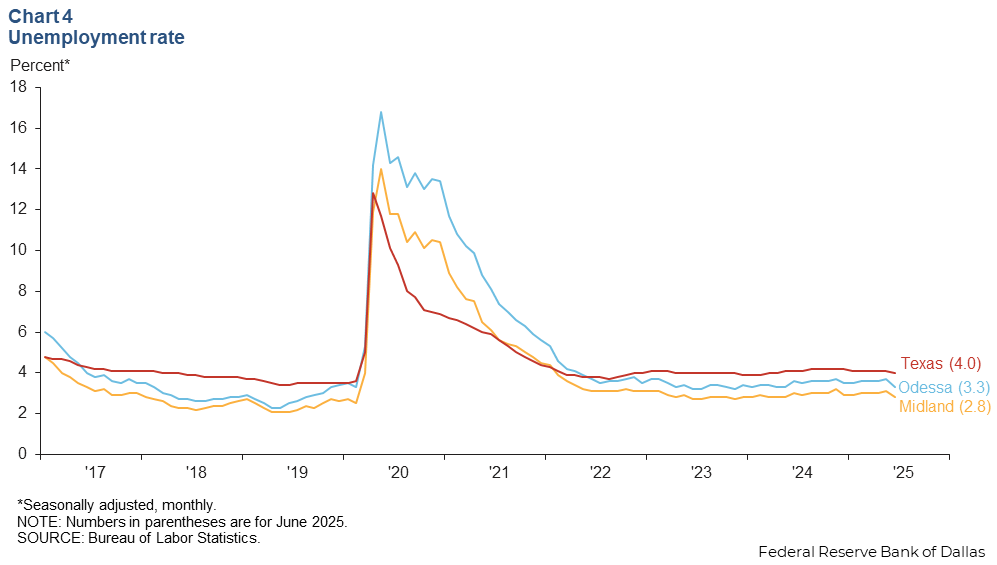
The unemployment rates in both Midland and Odessa were slightly lower in June compared with March (Chart 4). Midland’s unemployment rate decreased from 3.0 percent in March to 2.8 percent in June, while Odessa’s jobless rate decreased from 3.6 percent to 3.3 percent in the same period. Meanwhile, Texas’ unemployment rate decreased from 4.1 percent in March to 4.0 percent in June.
Housing
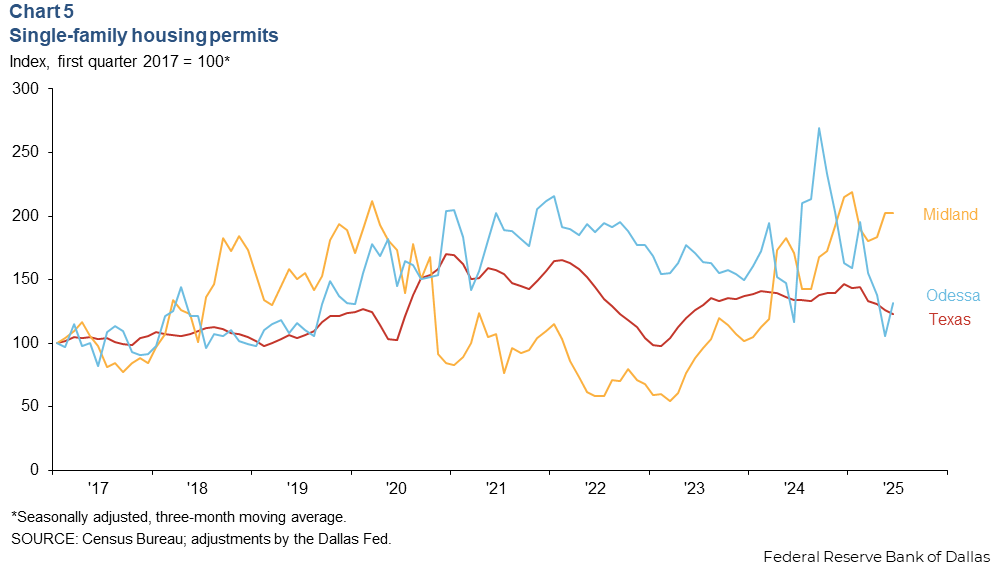
Single-family housing permits increase
Single-family housing permits in Midland increased in the second quarter compared with the first quarter but decreased in Odessa (Chart 5). Single-family housing permits in Midland were up 12.2 percent in June compared with March, but down 15.3 percent in Odessa. Single-family housing permits in the region were up 2.3 percent, while Texas single-family housing permits declined 8.0 percent over the same period.
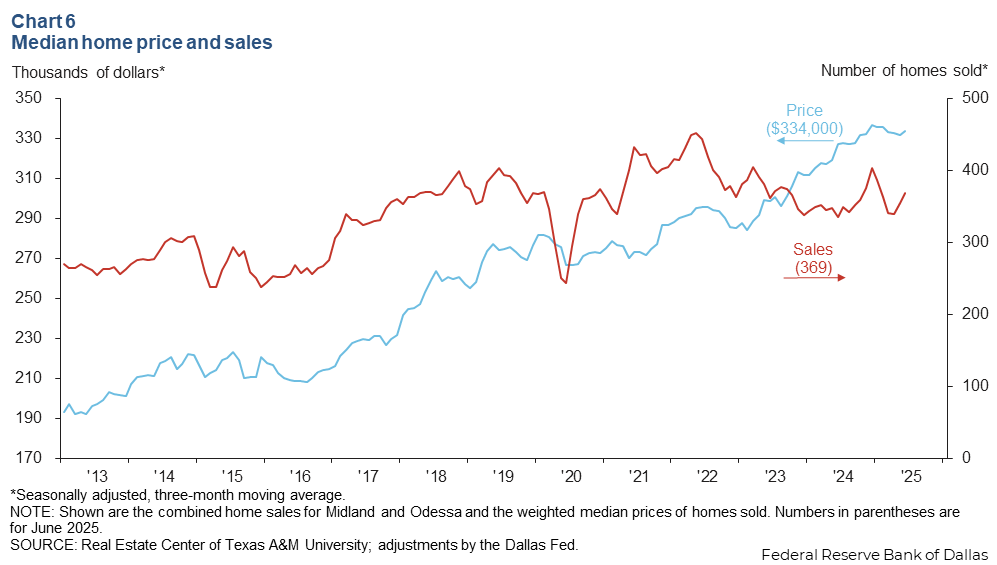
Home sales rise and prices flatten
Home sales in the Permian Basin were up 8.2 percent in June compared with March (Chart 6). June home sales in the region also increased 9.9 percent year over year. The median home sales price was little changed from March to June, but up 2.0 percent compared with June 2024. The median home sales price in the Permian Basin was $334,000 in June, in line with the state figure.
NOTES: Employment data are for the Midland–Odessa metropolitan statistical area (Martin, Midland and Ector counties), unless otherwise specified. Energy data include the 55 counties in West Texas and southern New Mexico that make up the Permian Basin region. Data may not match previously published numbers due to revisions.
About Permian Basin Economic Indicators
Questions or suggestions can be addressed to Adefemi Abimbola at adefemi.abimbola@dal.frb.org. Permian Basin Economic Indicators is released quarterly.