Rio Grande Valley Economic Indicators

| Rio Grande Valley economy dashboard (August 2025) | ||||
| Job growth (annualized) May–Aug. '25 |
Unemployment rate |
Avg. hourly earnings |
Avg. hourly earnings growth y/y |
|
| Rio Grande Valley | 1.6% | 6.7% | $21.09 | -1.5% |
| Brownsville | 3.8% | 7.1% | $22.10 | 7.1% |
| McAllen | 0.4% | 6.5% | $20.60 | -5.5% |
Employment increased in the Rio Grande Valley and unemployment rose in the three months ending in August. Year-over-year wage increases were mixed, with wages down in McAllen but up in Brownsville. Cross-border trade continued to fall. Water storage in Rio Grande Valley reservoirs is rising, though it remains well below historical levels. The area is especially exposed to government shutdown effects, with a higher share of the population receiving Supplemental Nutrition Assistance Program (SNAP) government benefits.
Labor market
Employment expands
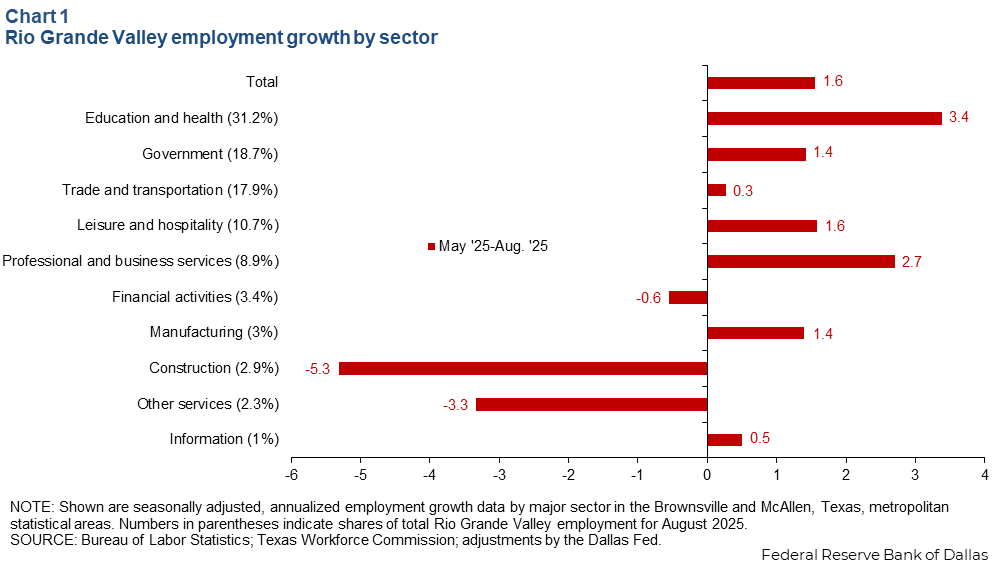
Rio Grande Valley employment increased an annualized 1.6 percent from May to August (1,800 jobs), faster than Texas (0.7 percent) and the U.S. (0.2 percent). Growth was mixed, led by education and health (1,200 jobs, or 3.4 percent), government (300 jobs, or 1.4 percent), and professional and business services (300 jobs, or 2.7 percent) (Chart 1). Employment contracted in a few sectors, with the largest decline in construction (down 200 jobs, or -5.3 percent).
Unemployment increases
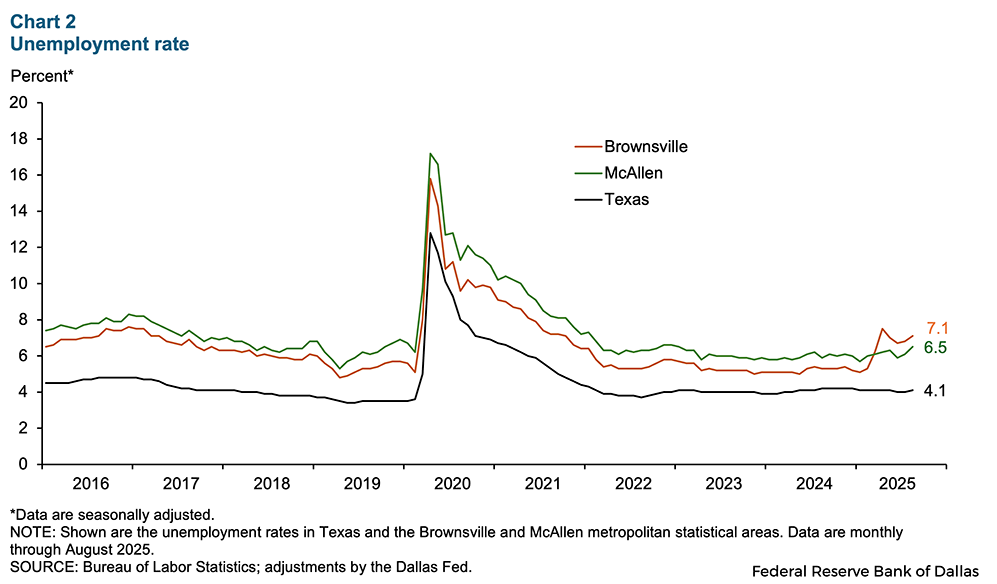
Since the beginning of the year the unemployment rate in Brownsville has risen 1.9 percentage points, putting it above the jobless rate in McAllen for the first time in over a decade. In August, Brownsville unemployment remained elevated at 7.1 percent (Chart 2). Although Brownsville’s labor force expanded, the number of unemployed rose faster. Unemployment rates in both metro areas were higher than the jobless rates of 4.1 percent in Texas and 4.3 percent in the U.S. in August.
Wage growth mixed
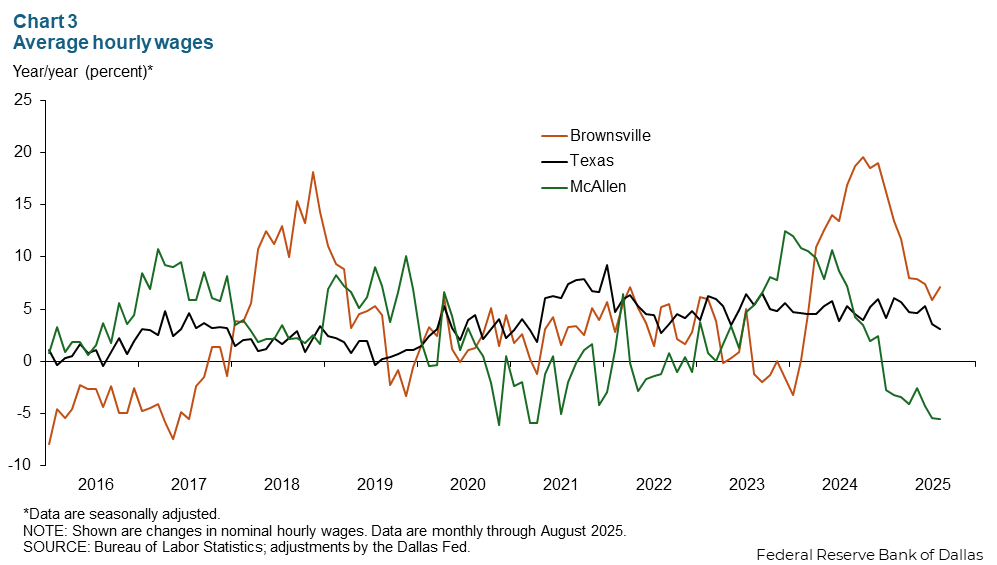
Private sector hourly wages in Brownsville continued to rise. Wages were up 7.1 percent year over year in August (Chart 3). Wages in McAllen were down 5.5 percent year over year and have been falling on a year-over-year basis since January. Wages rose 3.1 percent in Texas in August from year-earlier levels.
Water availability
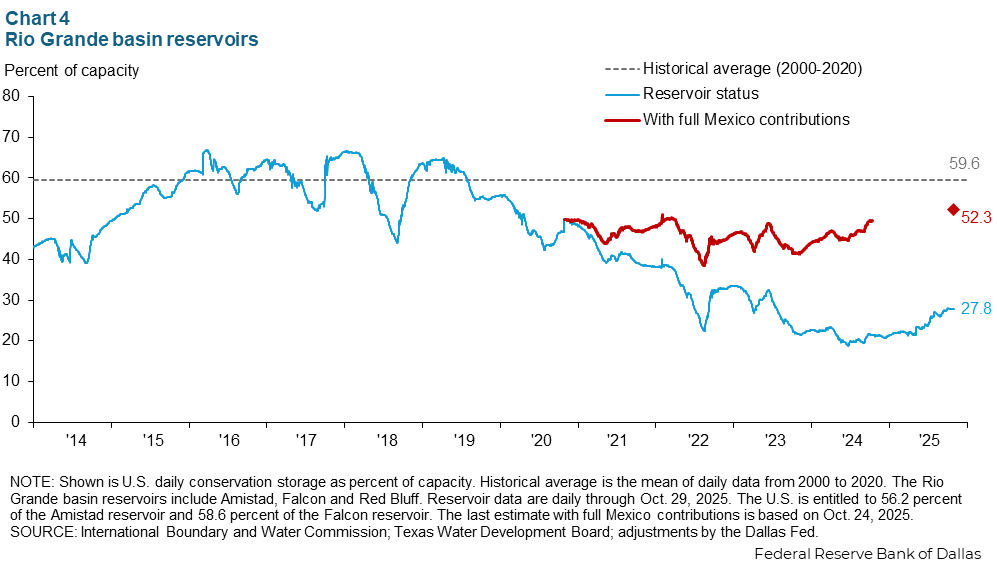
Farmers and households alike in the Valley depend on river water. Water levels in Rio Grande Valley reservoirs were at 27.8 percent of storage capacity in late October but remained 31.8 percentage points below their historical average (Chart 4).
Mexico and the U.S. recently came to an agreement for Mexico to deliver more water to the U.S. this year. Though the speed of transfers increased according to the International Boundary and Water Commission, Mexico has not caught up on deliveries.
Border activity
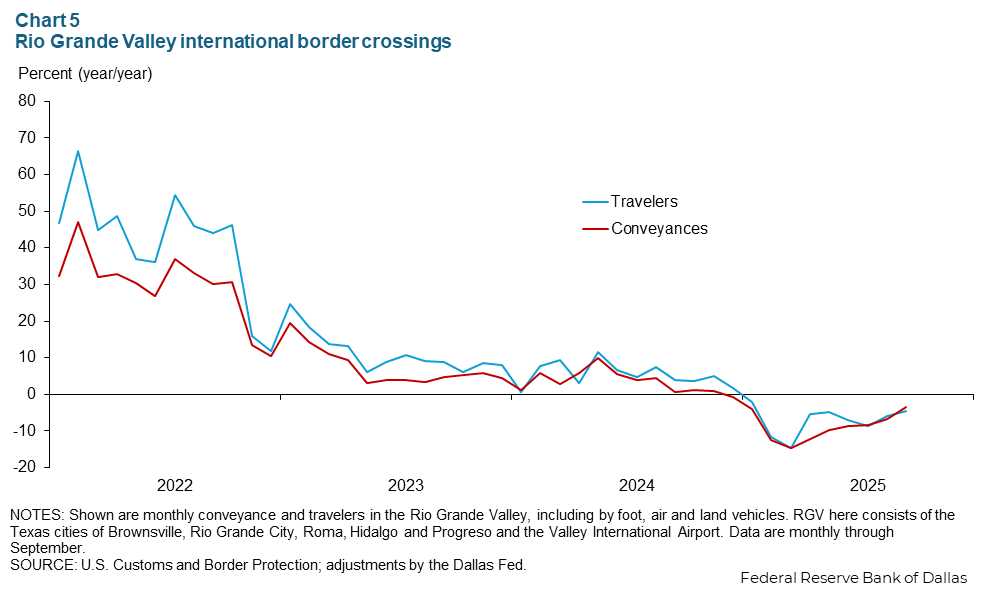
The movement of goods and people across the border in the Rio Grande Valley continued to decline in the third quarter of 2025. In September, conveyances were down 3.4 percent year over year, and the volume of travelers declined 4.6 percent (Chart 5). It is likely that trade uncertainty and tighter immigration policies continue to weigh on cross-border activity.
Government benefits
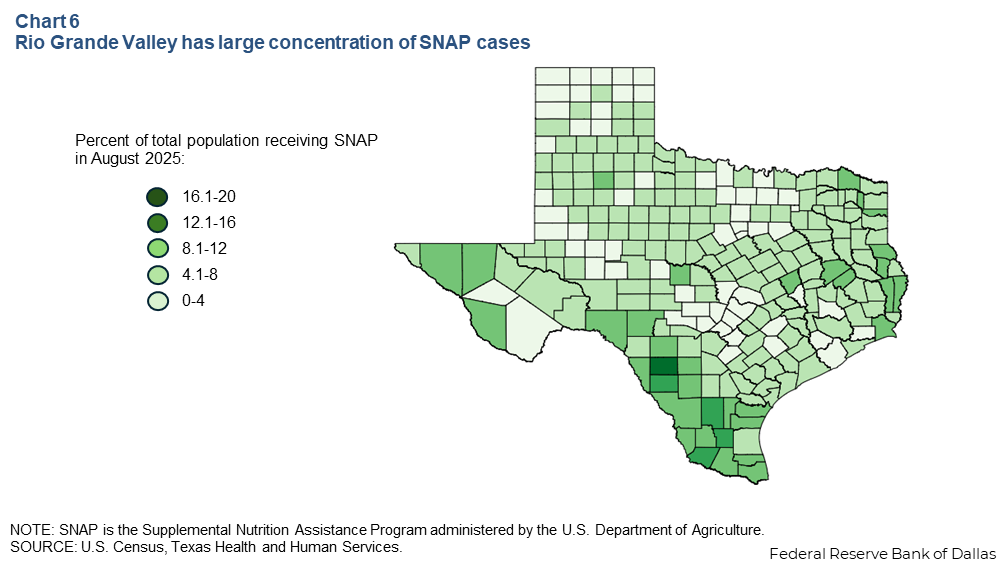
With the government shutdown ongoing, the risk of November SNAP benefits not being disbursed has increased. Chart 6 shows the percent of the population in Texas counties that receives SNAP benefits. Counties in the Rio Grande Valley have some of the highest proportions of population receiving SNAP aid. In Hidalgo County, which includes McAllen, 9.6 percent of residents receive SNAP benefits. The comparable figures are 9.8 percent in Cameron County, which includes Brownsville; 13.1 percent in Starr County, with Rio Grande City; and 10.5 percent in Willacy County, which includes Raymondville and South Padre Island.
NOTES: Employment data are for the McAllen–Edinburg–Mission and Brownsville–Harlingen metropolitan statistical areas (Cameron and Hidalgo counties), unless otherwise specified. Data may not match previously published numbers due to revisions.
About Rio Grande Valley Economic Indicators
Questions or suggestions can be addressed to Ethan Dixon at Ethan.Dixon@dal.frb.org. Rio Grande Valley Indicators is published quarterly.