Rio Grande Valley Economic Indicators

| Rio Grande Valley economy dashboard (December 2025) | ||||
| Job growth (annualized) Sep.–Dec. '25 |
Unemployment rate |
Avg. hourly earnings |
Avg. hourly earnings growth y/y |
|
| Rio Grande Valley | 1.1% | 6.5% | $21.55 | -0.8% |
| Brownsville | 0% | 6.9% | $21.28 | -0.1% |
| McAllen | 1.6% | 6.3% | $21.68 | -1.1% |
Employment increased in the Rio Grande Valley, while joblessness fell in the three months ended in December. Year-over-year wages declined in both metros. Cross-border trade continued to fall. Water storage in Rio Grande Valley reservoirs continues to rise, though it remains well below historical levels. Encounters at the southern border have remained consistently low since the start of 2025.
Labor market
Employment rises modestly
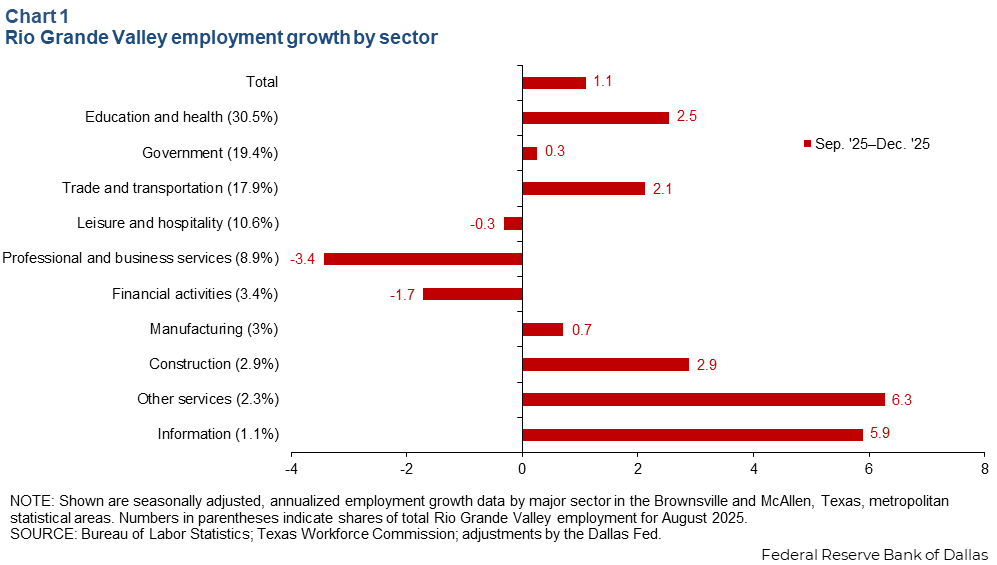
Rio Grande Valley employment increased an annualized 1.1 percent from September to December (1,300 jobs), faster than Texas (0.3 percent) and the U.S . (-0.1 percent). Growth was mixed, led by education and health (900 jobs, 2.5 percent) and trade and transportation (400 jobs, 2.1 percent) (Chart 1). Employment contracted in a few sectors, with the largest decline in professional and business services (–400 jobs, –3.4 percent).
Unemployment falls, but still elevated
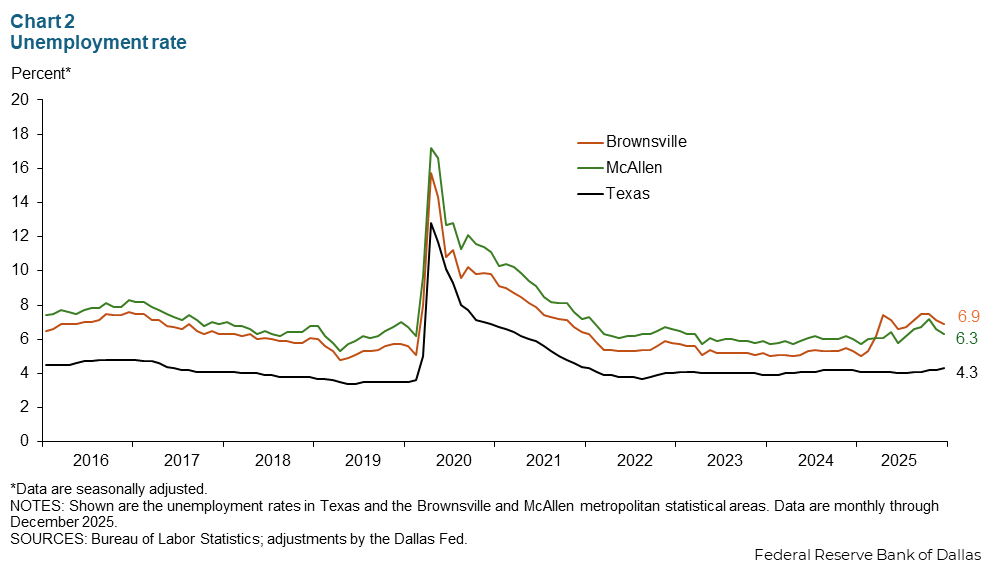
The unemployment rate in Brownsville remains higher than in McAllen, continuing to buck a years-long trend. In McAllen, the unemployment rate spiked to 7.2 percent in October, before falling.
In December, unemployment remained elevated in both metro areas, 6.9 percent in Brownsville and 6.3 percent in McAllen (Chart 2). Unemployment in both metros exceeded the jobless rates of 4.3 percent in Texas and 4.4 percent in the U.S.
Wages flat to down
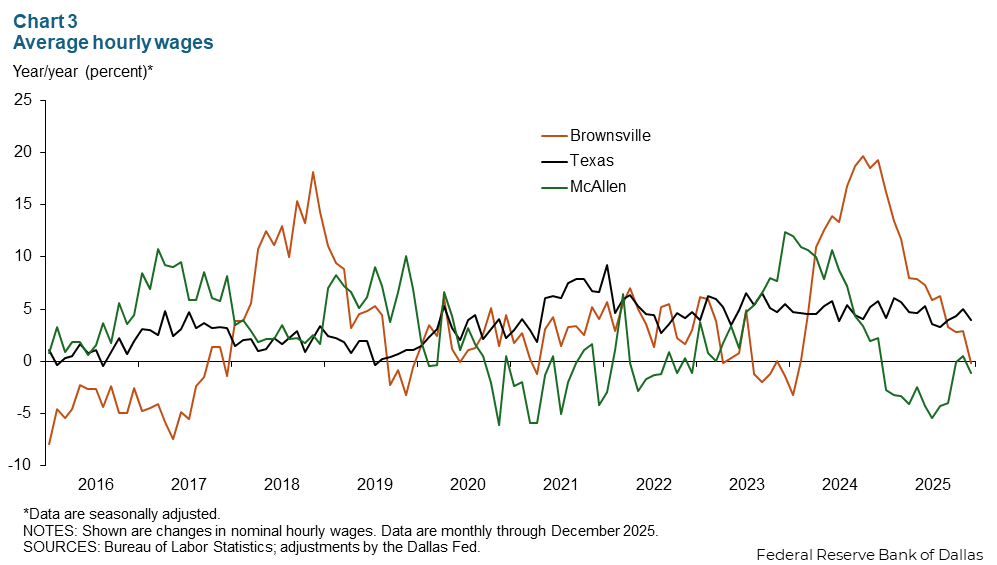
After a multiyear trend of rapidly increasing wages, private sector hourly wages in Brownsville fell 0.1 percent year over year in December (Chart 3). Wages in McAllen declined 1.1 percent in December from year-earlier levels. By comparison, wages in Texas rose 3.9 percent.
Water availability
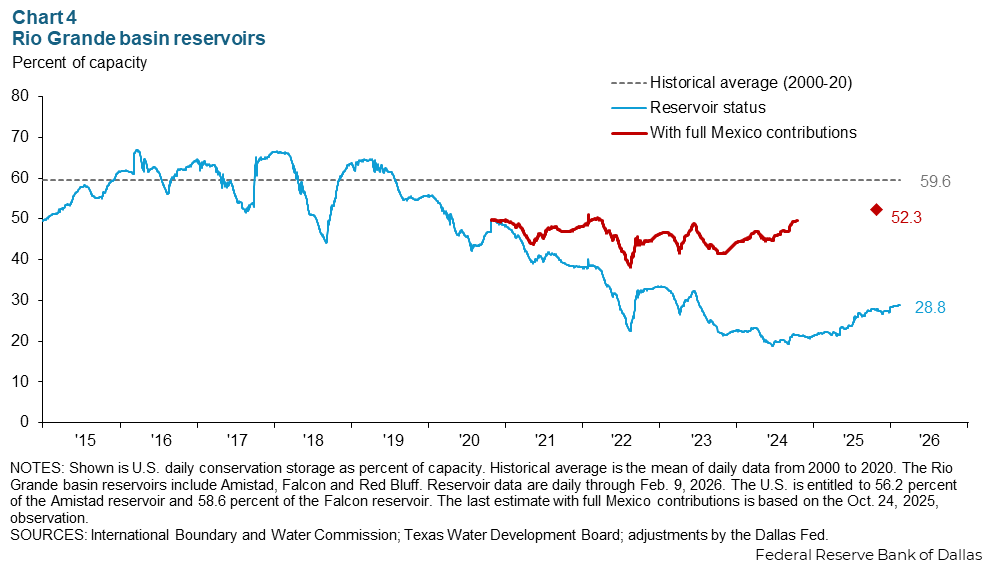
Farmers and households in the Valley depend on river water. Water levels in Rio Grande Valley reservoirs were at 28.8 percent of storage capacity in early February, remaining 30.8 percentage points below the historical average (Chart 4). In the five-year delivery cycle ended Oct. 24, 2025, Mexico failed to deliver its treaty-obligated amount by about 800,000 acre-feet. As of Jan. 31, 2026, Mexico had not delivered on promises under a 2025 agreement. McAllen is investing $185 million in other water sources, such as desalination.
Border activity
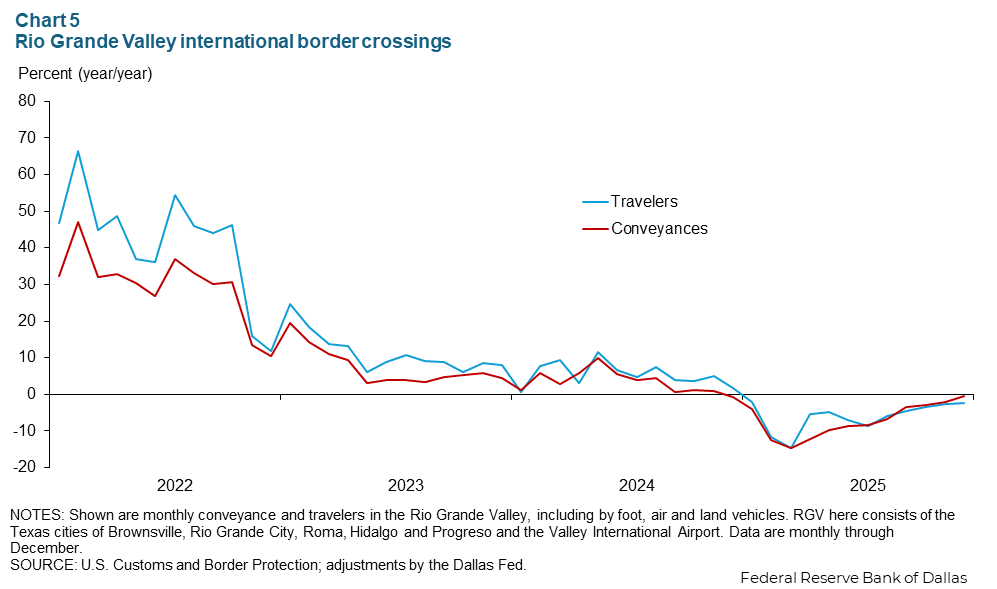
The movement of goods and people across the border in the Rio Grande Valley declined in fourth quarter 2025. Conveyances were down 0.4 percent year over year, and the volume of travelers declined 2.4 percent in December (Chart 5). Trade uncertainty and tighter immigration policies likely weigh on cross-border trade and travel.
Immigration cools
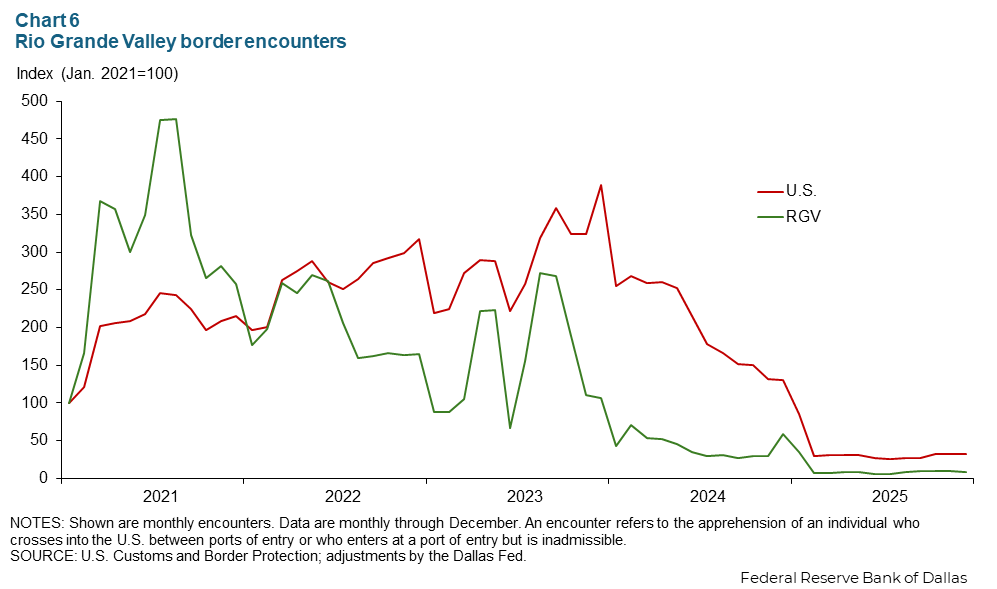
Border Patrol encounters in the Rio Grande Valley sector fell to near zero at the beginning of 2025 and have maintained that level. Overall encounters in the Rio Grande Valley are at their lowest level since mid-2023. An encounter refers to the apprehension of an individual who crosses into the U.S. between ports of entry or who enters at a port of entry but is inadmissible.
Notes
Employment data are for the McAllen–Edinburg–Mission and Brownsville–Harlingen metropolitan statistical areas (Cameron and Hidalgo counties), unless otherwise specified. Data may not match previously published numbers due to revisions.
NOTE: Data may not match previously published numbers due to revisions.
About Rio Grande Valley Economic Indicators
Questions or suggestions can be addressed to Ethan Dixon. Rio Grande Valley Economic Indicators is released quarterly.