San Antonio Economic Indicators

The San Antonio economy expanded at a steady pace in January. The San Antonio Business-Cycle Index grew slightly above its long-term trend despite weak job growth and an uptick in the unemployment rate. Other indicators such as wages and stocks softened, although indicators of real estate activity remained strong.
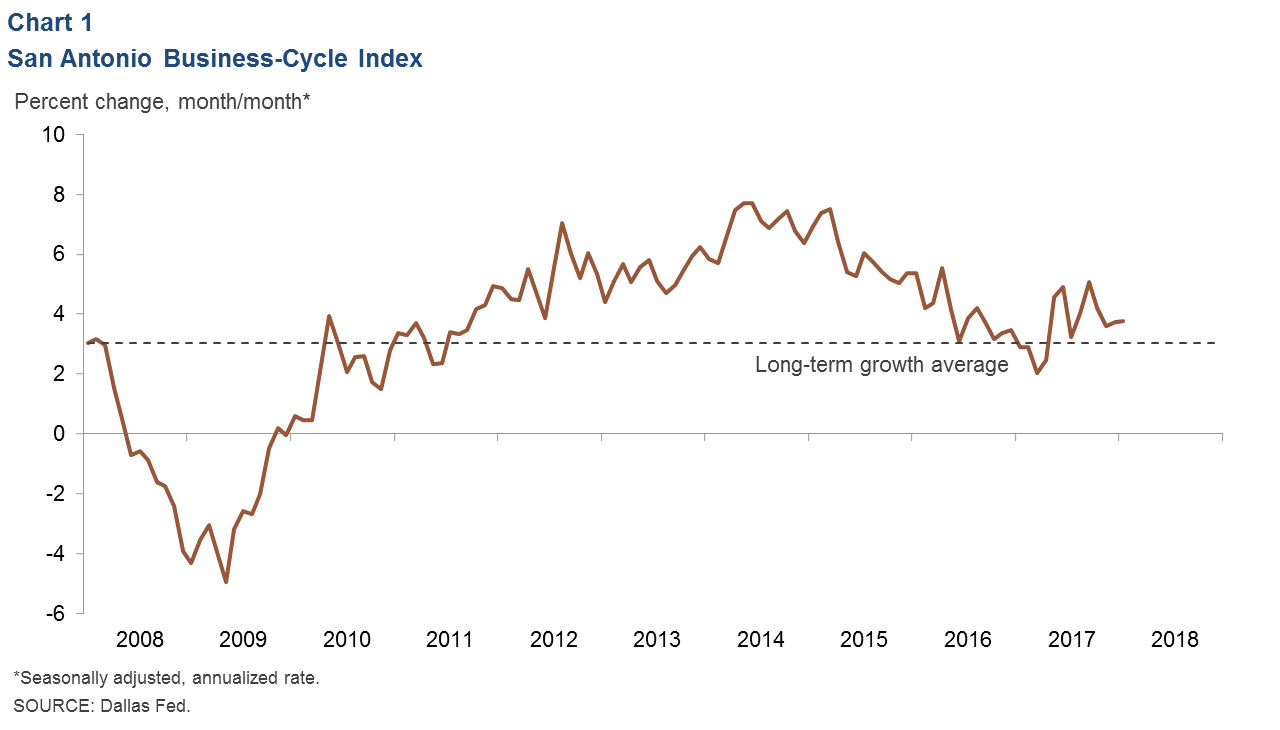
Business-Cycle Index
The San Antonio Business-Cycle Index expanded at a 3.7 percent annualized rate in January, similar to December’s rate and above the long-term rate of 3.1 percent (Chart 1). January job growth was flat, while the unemployment rate rose slightly. Less-timely data for real retail sales and total wages paid—the other two components of the index—show mixed signals. Retail sales saw a modest 0.7 percent increase in year-over-year growth in the second quarter of last year, while wages paid slipped 1.3 percent in the third quarter.
Labor Market
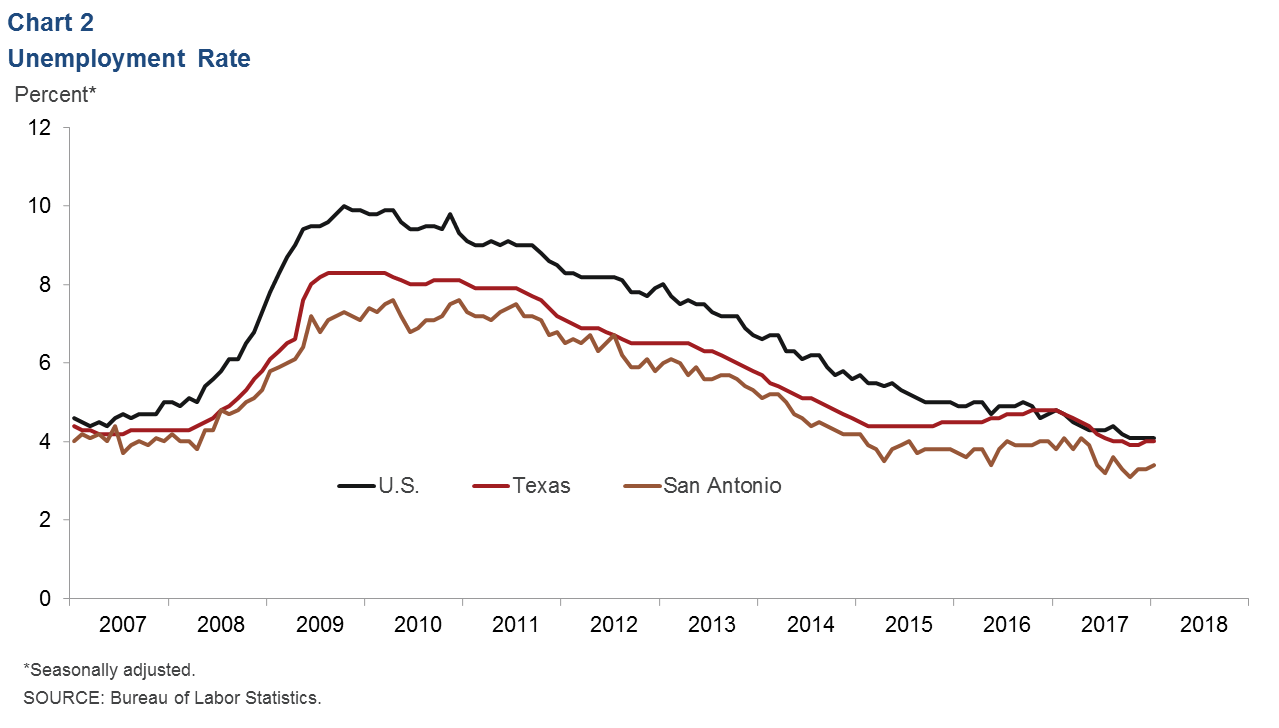
Unemployment Rate Still at Low Level
The San Antonio unemployment rate increased slightly to 3.4 percent in January (Chart 2). The Texas and U.S. rates held steady at 4.0 percent and 4.1 percent, respectively. With the Bureau of Labor Statistics’ annual revision, the San Antonio jobless rate was revised down significantly last year, touching a 17-year low of 3.1 percent last October. Labor force growth was revised down to 2.3 percent, although it was still above the long-term average rate of 2 percent.
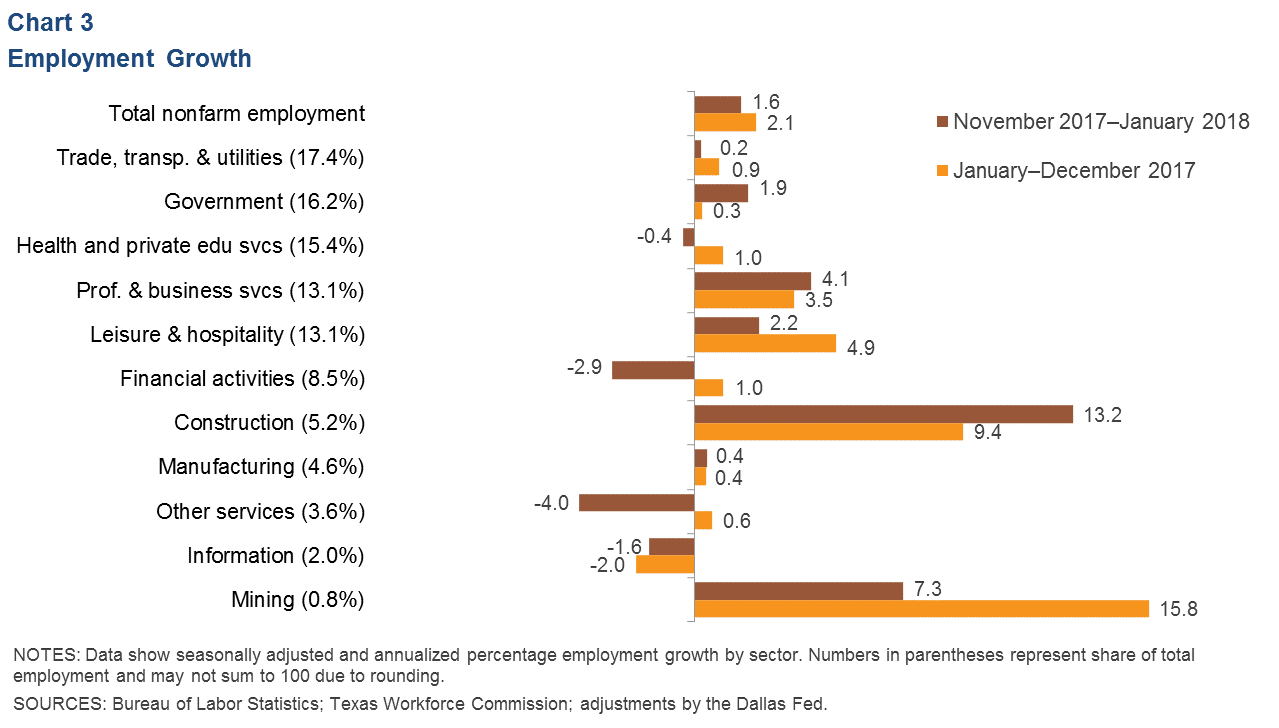
Job Growth Cools in Recent Months
San Antonio jobs increased at a 1.6 percent annualized rate over the three months through January (Chart 3). Growth was strong in goods-producing industries, with mining adding jobs at a rapid pace and construction hiring up due to the demand for specialty trade contractors. Service sector performance was more mixed as financial activities, health care, information and other services saw declines. Professional and business services grew steadily, with hiring in scientific and technical services accelerating after falling in the prior three-month period. Leisure and hospitality moderated after rising in the post-Hurricane Harvey period.
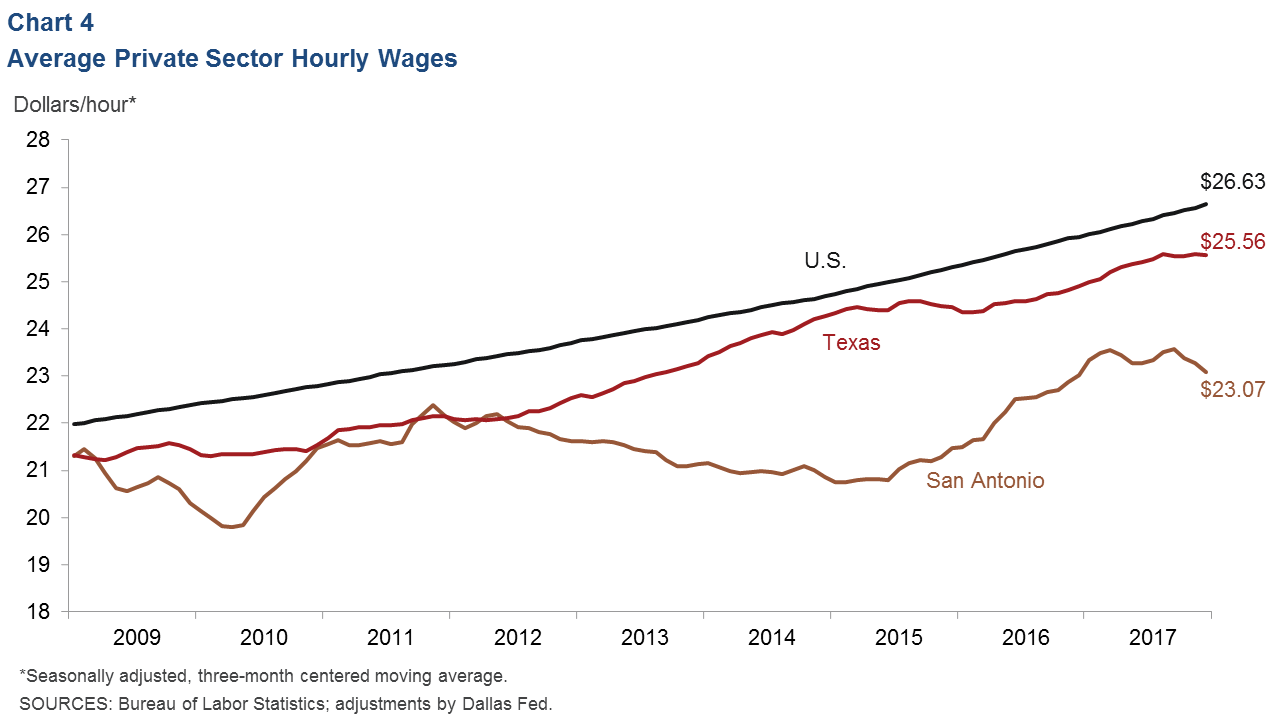
Wages Slip Toward End of 2017
Average hourly wages in San Antonio’s private sector fell modestly at the end of last year to $23.07 per hour (Chart 4). Meanwhile, wages were flat in Texas and picked up moderately in the U.S. The decline in San Antonio wages is likely due in part to compositional effects following the surge of hiring in lower-wage leisure and hospitality jobs after the hurricane.
Real Estate
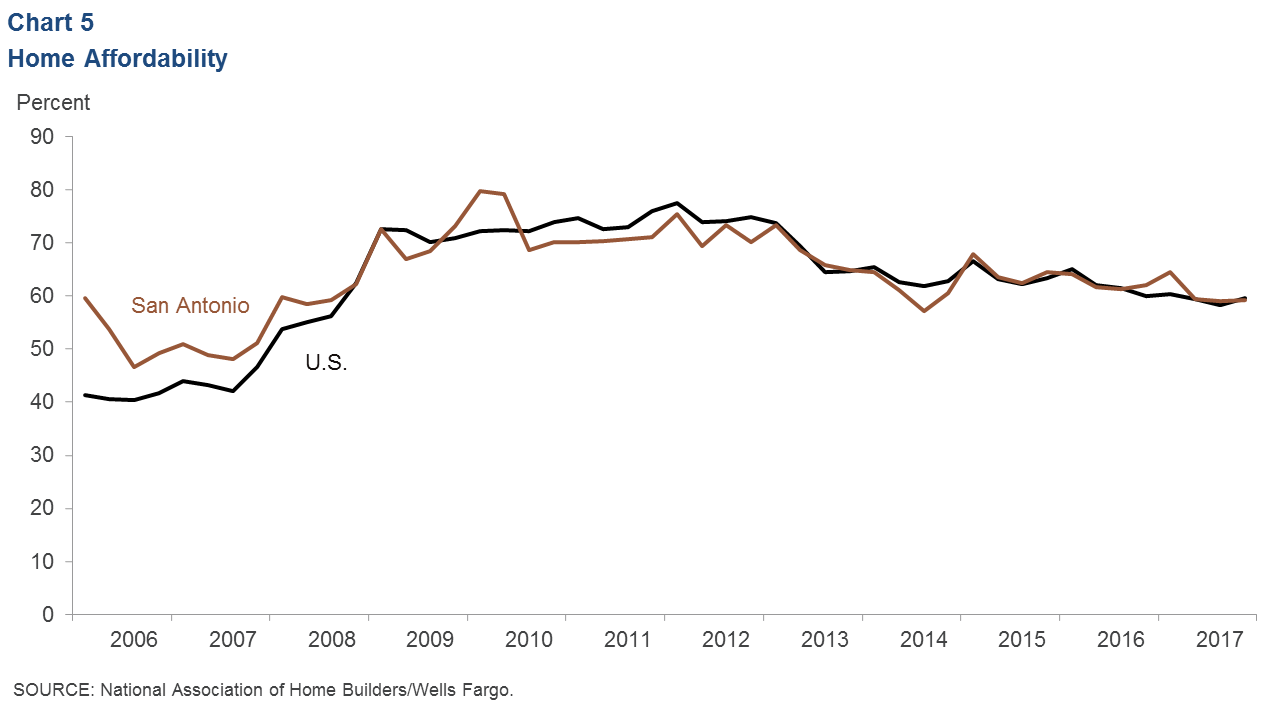
Home affordability held steady in San Antonio in the fourth quarter of last year. The share of homes sold that a median-income family could qualify for was 59.2 percent, comparable to the U.S. share of 59.6 percent (Chart 5). The January median sales price reached an all-time high of $221,902, while inventories of existing homes fell to 3.3 months’ supply. According to data from the Real Estate Center at Texas A&M University, 45 percent of homes sold last year in San Antonio were under $200,000, compared with 41.6 percent for Texas overall.
Stock Prices
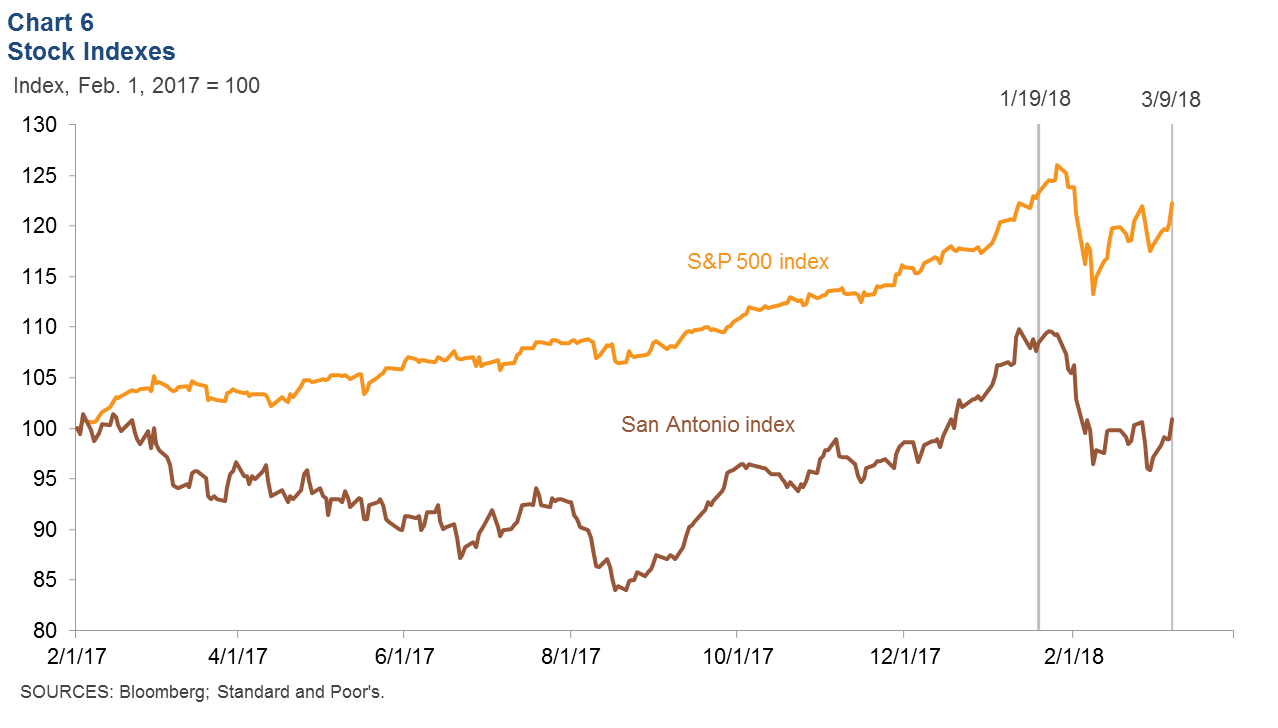
Stock prices of companies with a significant presence in San Antonio shed 6.9 percent of their value from Jan. 19 to March 9, compared with a 0.8 percent decline in the S&P 500 over the same time (Chart 6). After peaking at an all-time high on Jan. 23, the San Antonio stock index plummeted nearly 13 percent before regaining some ground. Weakness was broad based across most industries, and energy, retail and manufacturing firms saw significant declines.
NOTE: Data may not match previously published numbers due to revisions.
About San Antonio Economic Indicators
Questions can be addressed to Christopher Slijk at christopher.slijk@dal.frb.org. San Antonio Economic Indicators is published every month on the Thursday after state and metro employment data are released.