San Antonio Economic Indicators

The San Antonio economy expanded at a steady pace in February. The San Antonio Business-Cycle Index grew slightly above its long-term trend, although job growth was modest and the unemployment rate rose slightly. Real estate market indicators suggested some cooling in new-home construction but continued strong demand so far this year. 2017 census data show robust growth in San Antonio’s population even as state growth slowed.
Business-Cycle Index
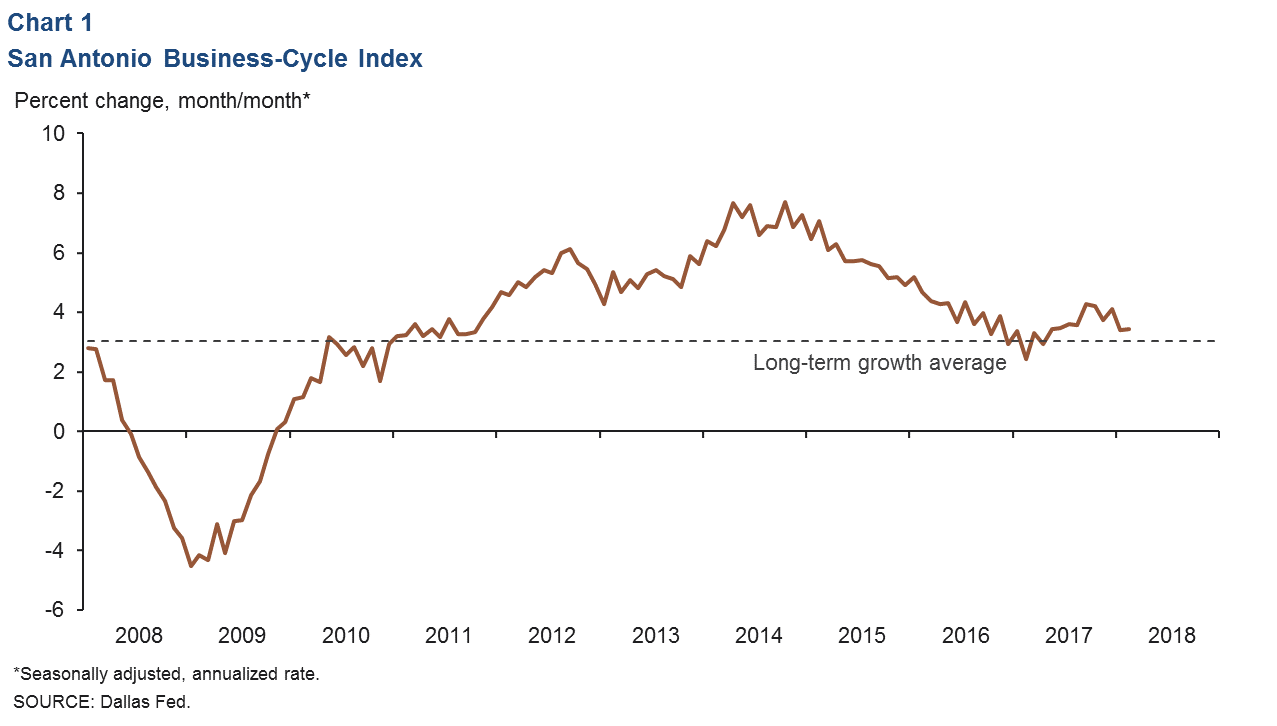
The San Antonio Business-Cycle Index expanded at a 3.4 percent annualized rate in February, similar to January’s rate (Chart 1). However, this is slightly below the 3.5 percent average rate for 2017. February job growth was positive but weak, and the unemployment rate ticked up slightly. Meanwhile, forward-looking indicators such as help-wanted advertising suggest continued healthy labor demand in the region going forward.
Labor Market
Unemployment Rate Remains Below State Average
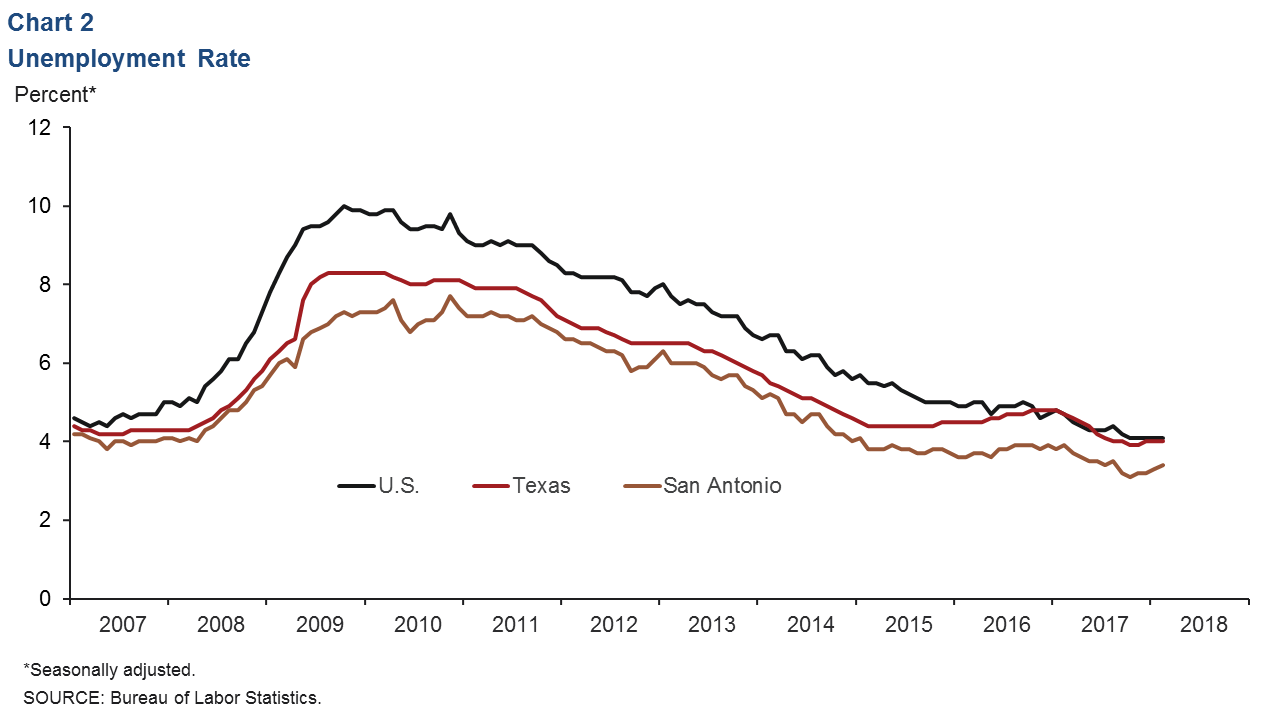
The San Antonio unemployment rate increased slightly to 3.4 percent in February (Chart 2). The Texas and U.S. rates held steady at 4.0 percent and 4.1 percent, respectively. Labor force growth picked up sharply, and the two-month change through February increased to an annualized 6.3 percent, the fastest pace since 2010.
Job Growth Robust
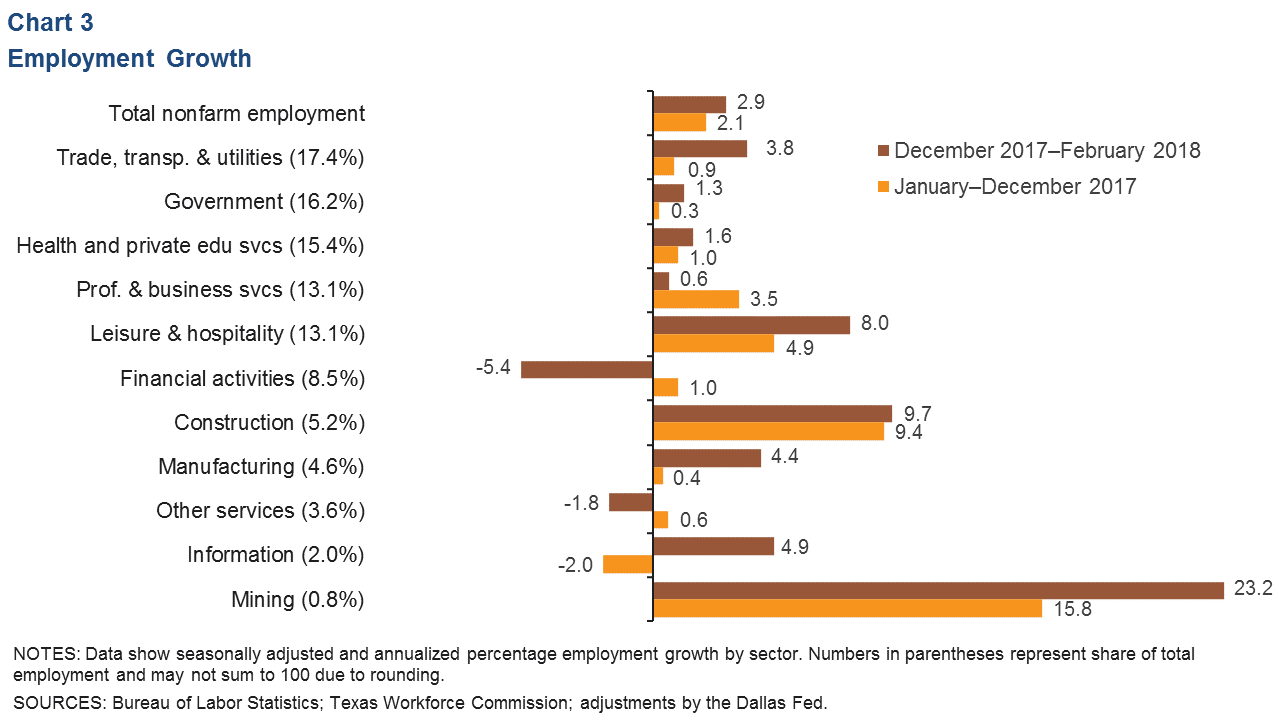
San Antonio jobs increased at a 2.9 percent annualized rate over the three months through February (Chart 3). Growth continued to pick up in goods-producing industries: Construction employment surged due to strong hiring of specialty trade contractors, mining picked up sharply, and manufacturing rebounded after showing weakness toward the end of last year. Growth in the service sector was also broad based, with only financial activities and other services seeing a significant decline. Leisure and hospitality led overall gains, adding 2,600 jobs over this period. Job growth in trade, transportation and utilities accelerated, with retail trade posting a healthy rebound. Health care, government and professional services also saw employment gains.
Population
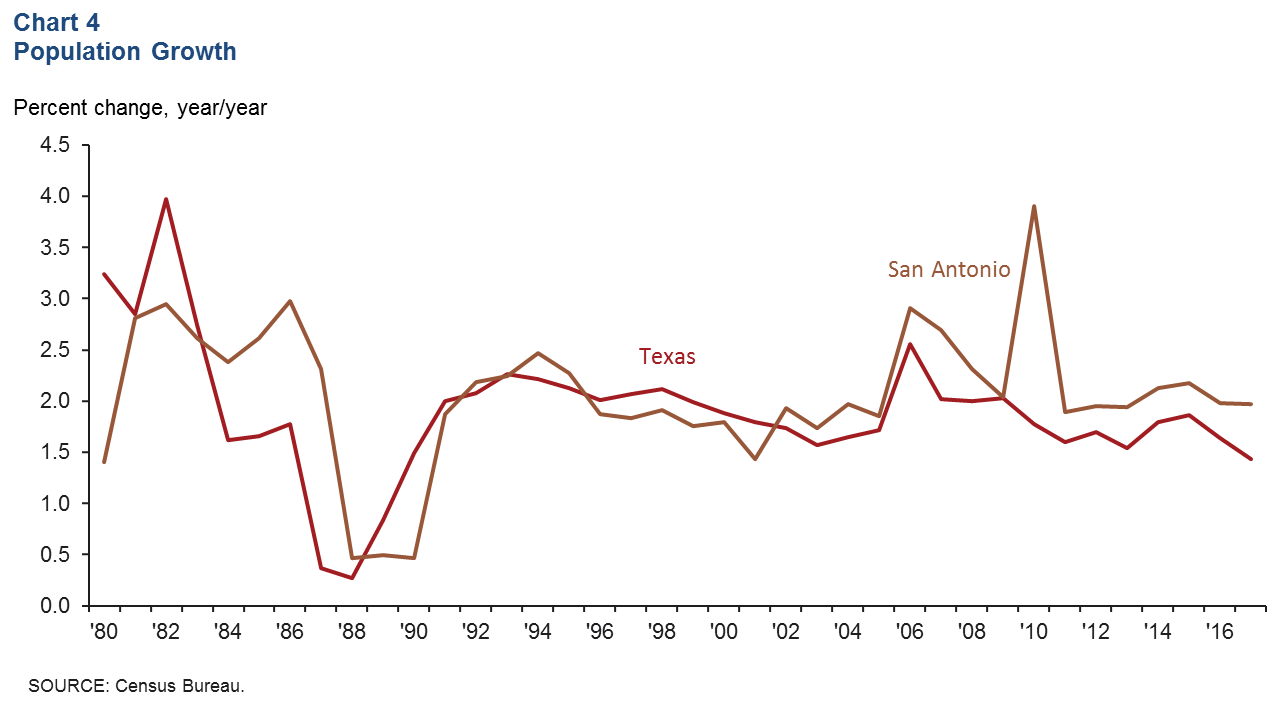
Population growth in San Antonio was steady in 2017. Recently released census data show San Antonio’s population grew at a 2.0 percent rate, similar to 2016 and near its long-term average of 2.1 percent (Chart 4). This contrasts with Texas’ growth, which slowed to 1.4 percent last year.
Real Estate
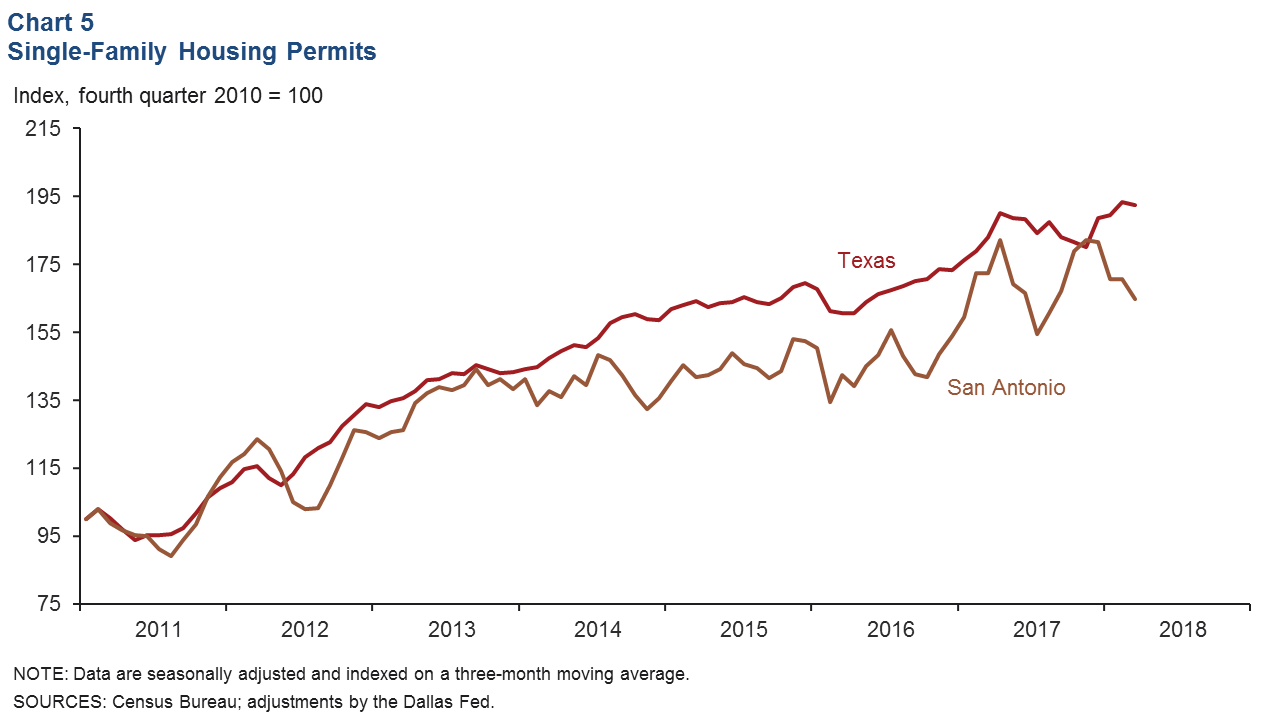
Permits for new single-family home construction in San Antonio slipped in recent months, with the three-month average through February falling to its lowest point since mid-2017 (Chart 5). In contrast, Texas permits have continued to trend upward and were down only slightly from a postrecession high in January. Nevertheless, home inventories remain lean in San Antonio at 3.3 months’ supply, and existing-home sales and the median home price continue to hold near all-time highs.
Stock Prices
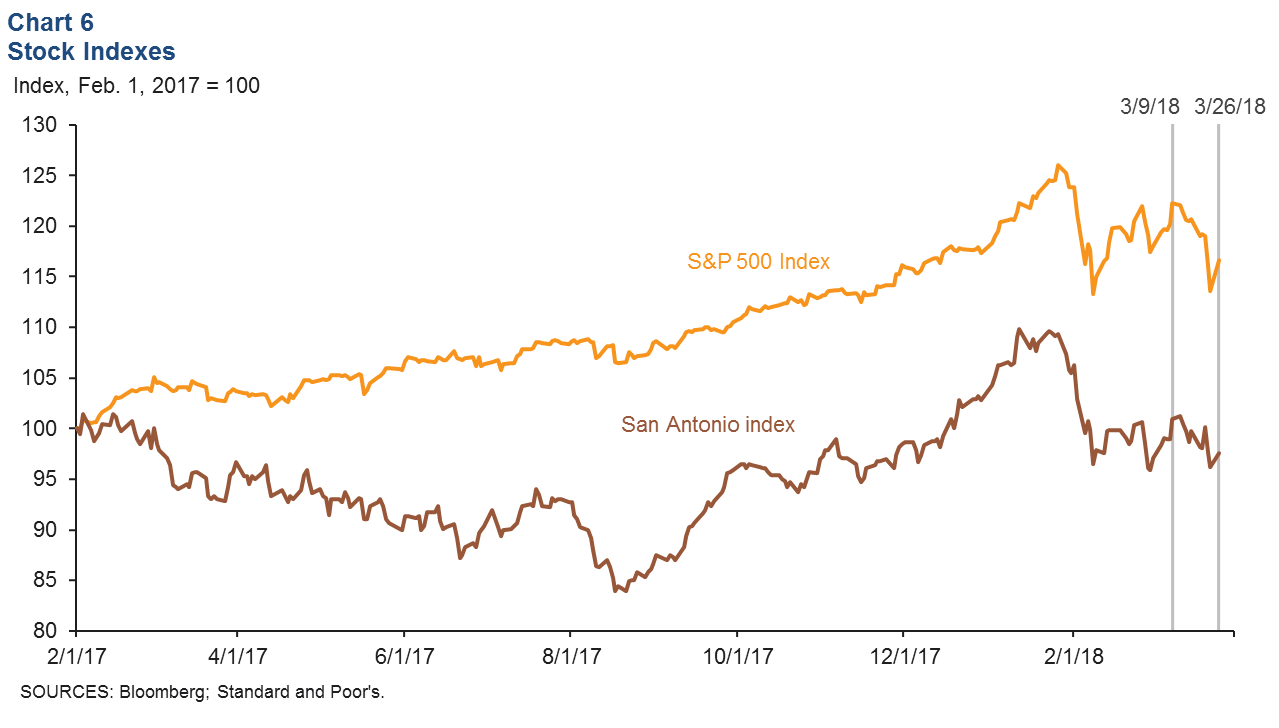
Stock prices of companies with a significant presence in San Antonio fell 3.3 percent from March 9 to March 26, compared with a 4.6 percent drop in the S&P 500 over the same time (Chart 6). Most industries had moderate declines, with finance and food services firms seeing the most significant pullback. Performances among energy and communications stocks were more mixed.
NOTE: Data may not match previously published numbers due to revisions.
About San Antonio Economic Indicators
Questions can be addressed to Christopher Slijk at christopher.slijk@dal.frb.org. San Antonio Economic Indicators is published every month on the Thursday after state and metro employment data are released.