San Antonio Economic Indicators

Growth in the San Antonio economy remained mild in July. The San Antonio Business-Cycle Index accelerated, though it remains below its long-term average. The unemployment rate fell to an eight-month low, but job growth remained tepid. Wages picked up sharply, and home affordability declined in the second quarter.
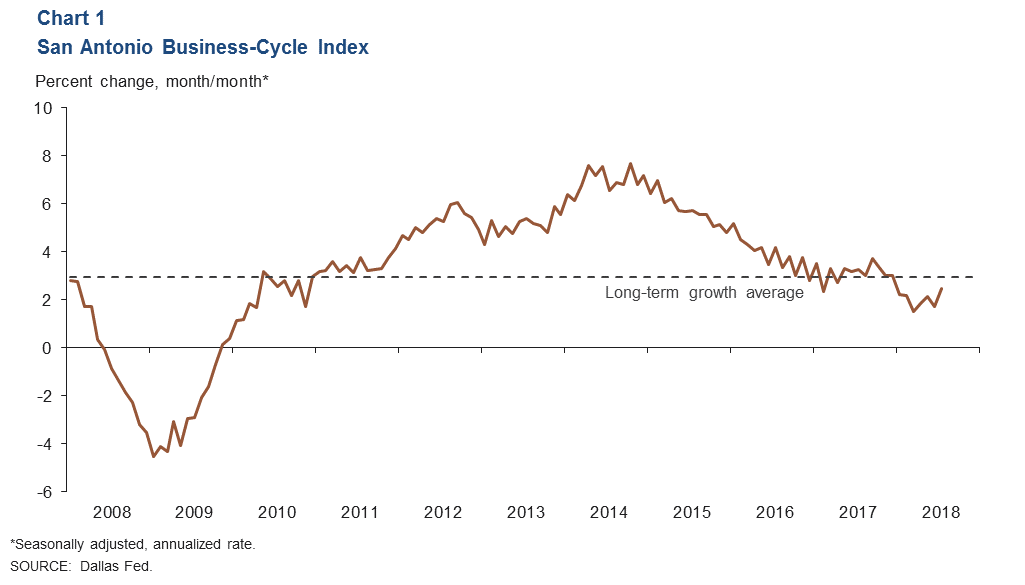
Business-Cycle Index
The San Antonio Business-Cycle Index expanded at a 2.5 percent annualized rate in July, up from June’s 1.7 percent but still below its long-term average of 3 percent (Chart 1). Job growth remained weak at 0.9 percent in July, although the unemployment rate declined. The index has grown below trend since the end of 2017, possibly due to labor market tightness restraining job growth.
Labor Market
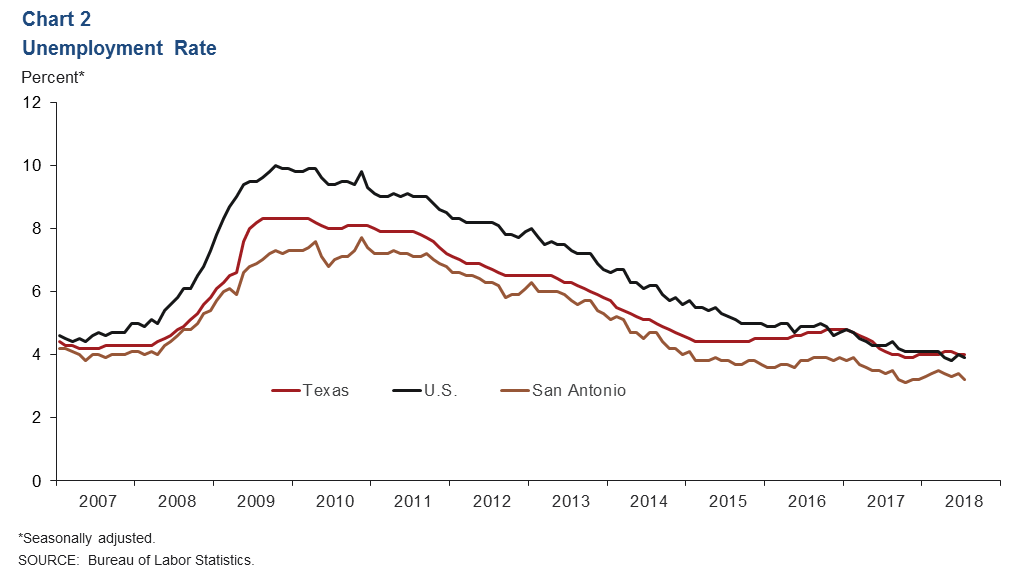
Unemployment Rate Remains Below State Average
The San Antonio unemployment rate fell to 3.2 percent in July from 3.4 percent in June (Chart 2). This was significantly below the Texas rate of 4.0 percent and the U.S. rate of 3.9 percent. The San Antonio labor force has grown an annualized 0.7 percent over the first seven months of the year, compared with 3 percent for the state and 1.8 percent nationally.
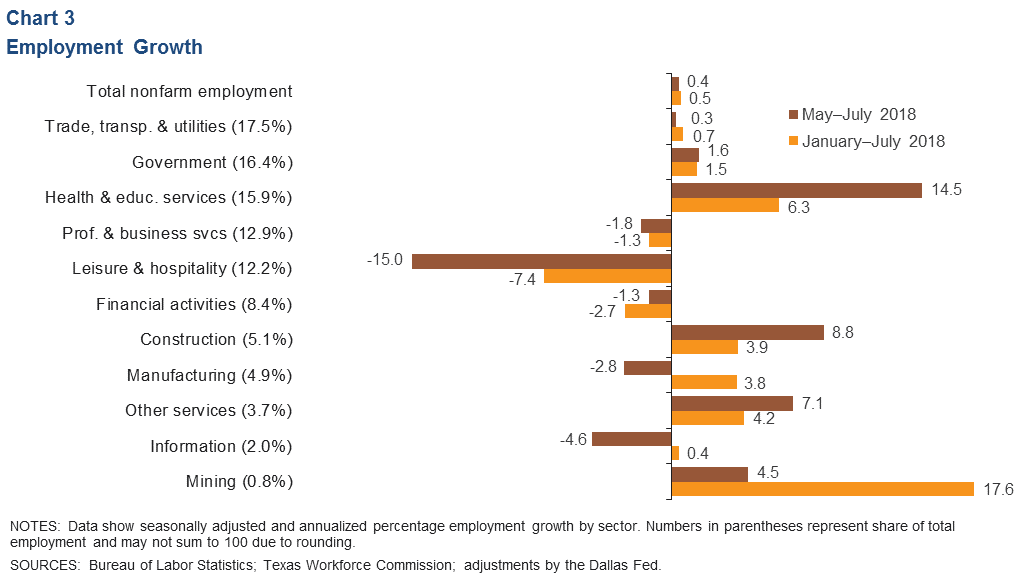
Job Growth Remains Soft
San Antonio jobs grew at a 0.4 percent annualized rate over the three months through July, slightly below the year-to-date rate of 0.5 percent (Chart 3). Growth across industries was mixed, with health care employment surging but leisure and hospitality employment plummeting. Other services and mining grew at a healthy pace, while the remaining private services sectors were flat or shed jobs over the three-month period. Construction jobs picked up, with a net addition of nearly 900 specialty trade contractor jobs alone.
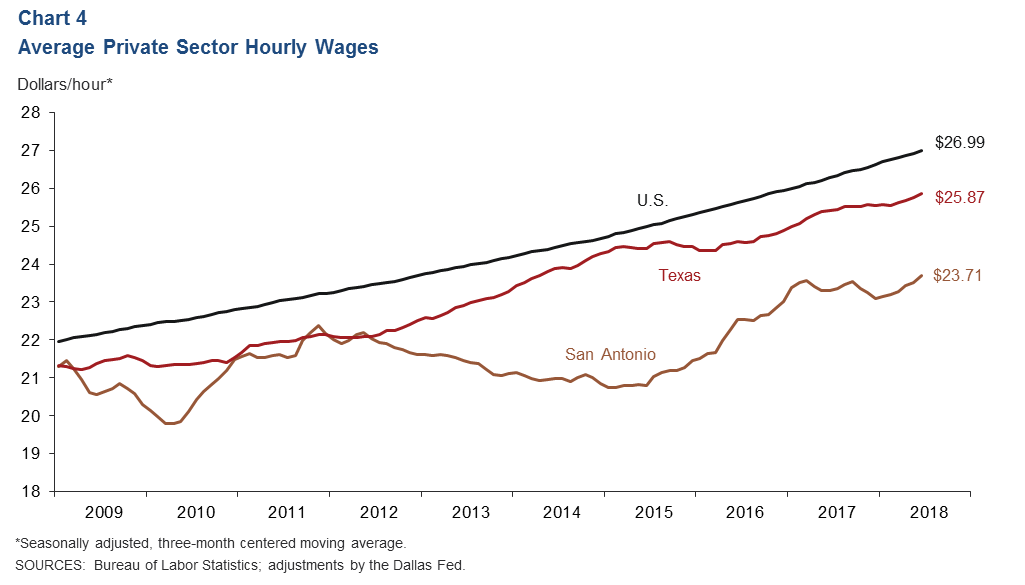
Hourly Wages Accelerating
San Antonio private sector hourly wages rose in July, and the three-month average climbed to its highest level since 2008 (Chart 4). Over the first half of the year, wages grew an annualized 5.4 percent locally, compared with 2.6 percent in Texas and 2.7 percent in the U.S. Some of the increase may be compositional, however, as weakness in low-paying leisure and hospitality jobs may be pushing up the average wage.
Real Estate
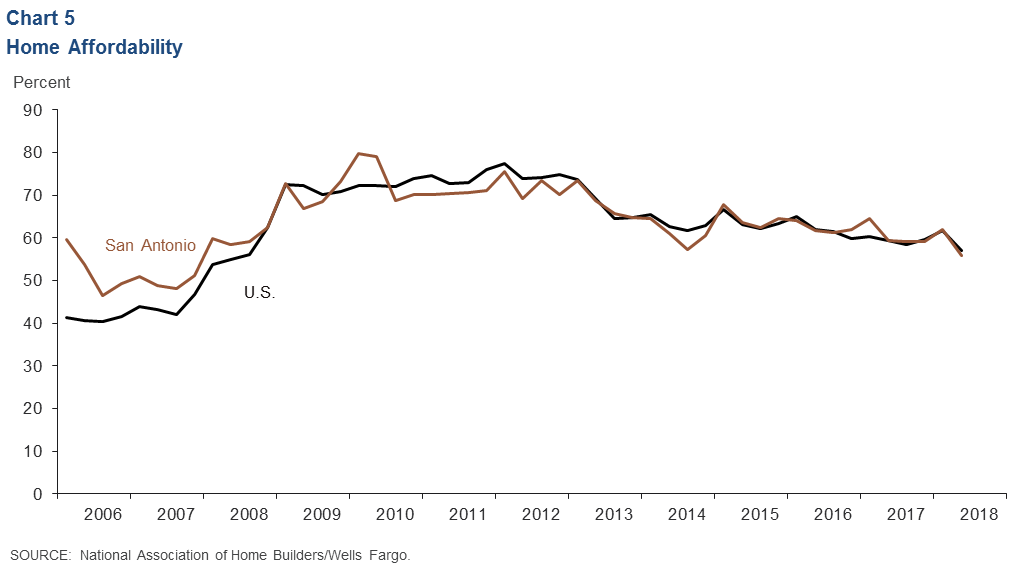
San Antonio home affordability declined in the second quarter (Chart 5). The share of homes sold that the median-income household could afford fell from 62 percent to 55.8 percent, a sharper decline than the 4.5 percentage-point drop in the national average to 57.1 percent. July home inventories declined to a low 3.3 months’ supply, and seasonally adjusted home sales rose to an all-time high of 2,895.
Stock Prices
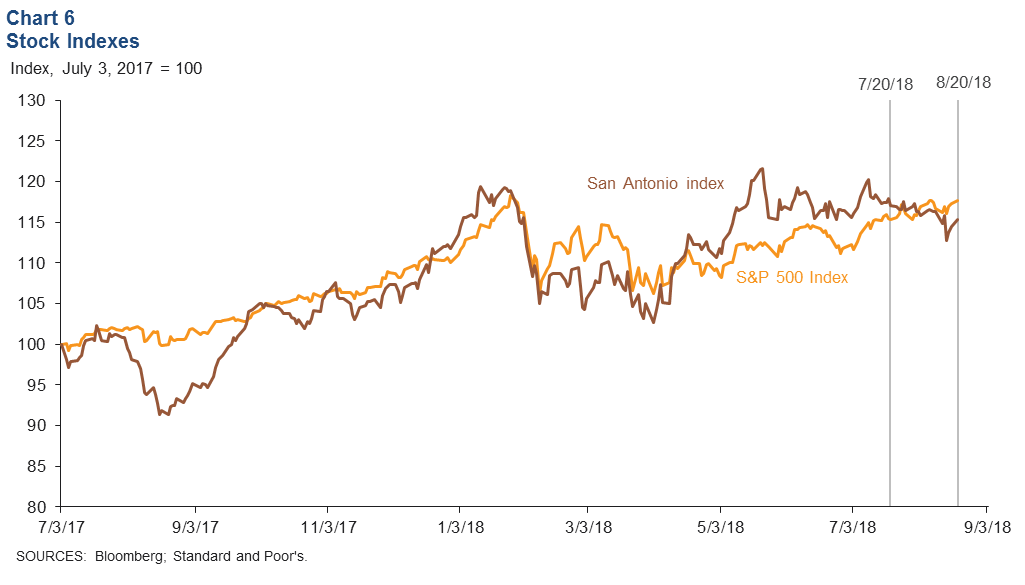
Stock prices of companies with a significant presence in San Antonio declined 1.6 percent from July 20 to August 20, compared with a 2.0 percent rise in the S&P 500 over that time (Chart 6). Declines were driven by softness in energy, communications and retail firms. Manufacturing, refining and financial firms saw a moderate pickup.
NOTE: Data may not match previously published numbers due to revisions.
About San Antonio Economic Indicators
Questions can be addressed to Christopher Slijk at christopher.slijk@dal.frb.org. San Antonio Economic Indicators is published every month on the Thursday after state and metro employment data are released.