San Antonio Economic Indicators

Growth in the San Antonio economy remained soft in October. The San Antonio Business-Cycle index accelerated, though growth continued to be below its long-term average. The unemployment rate declined slightly from September, while job growth remained soft. Housing prices rose further in the third quarter, while home affordability fell.
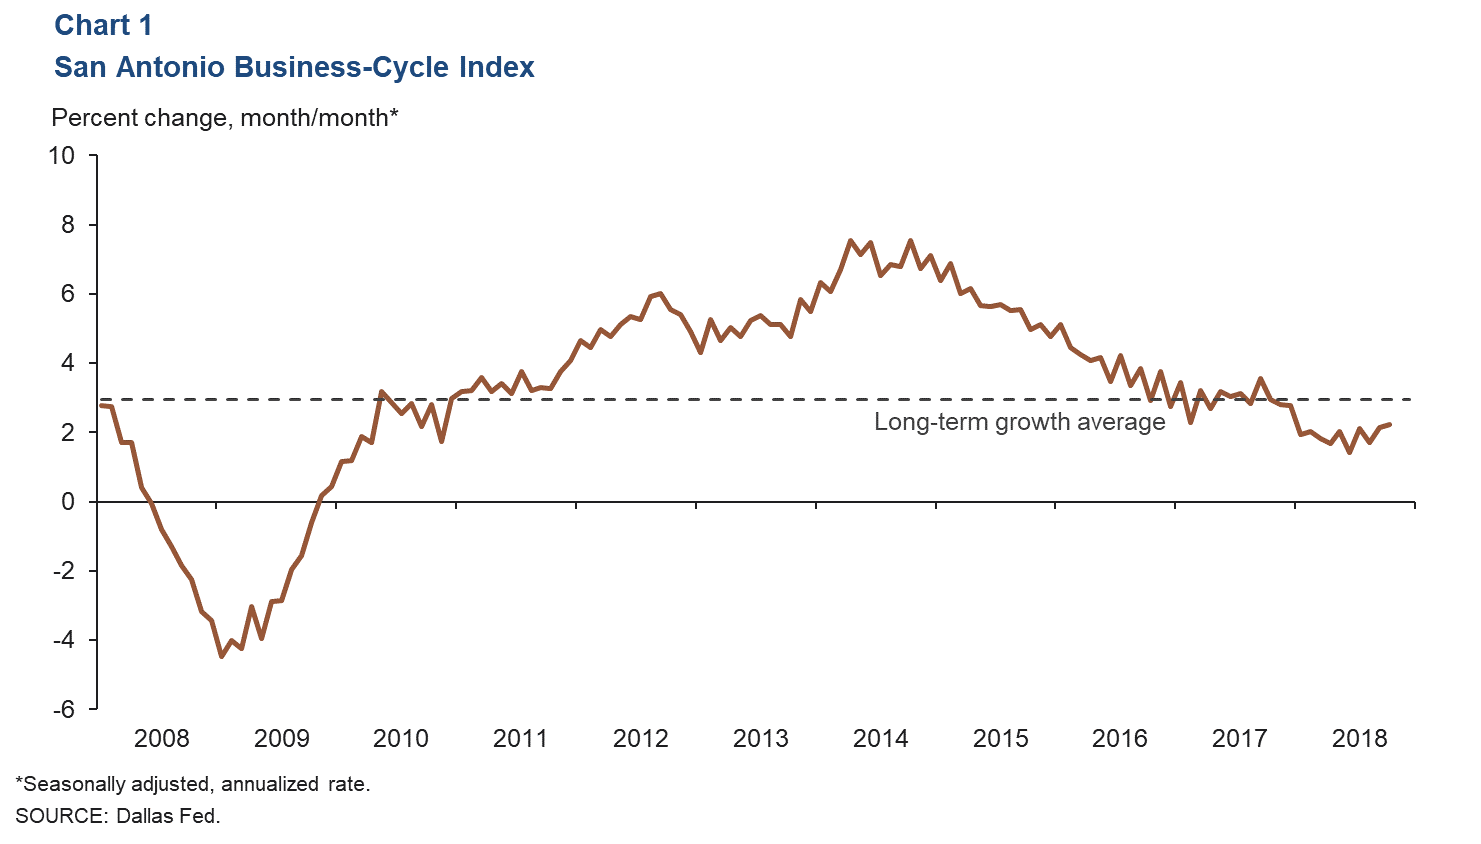
Business-Cycle Index
The San Antonio Business-Cycle Index expanded at a 2.2 percent annualized rate in October, similar to September's 2.1 percent increase but still under the long-term average of 2.9 percent (Chart 1). Year-to-date job growth remained weak at a scant 0.6 percent, whereas the unemployment rate dipped in October.
Labor Market
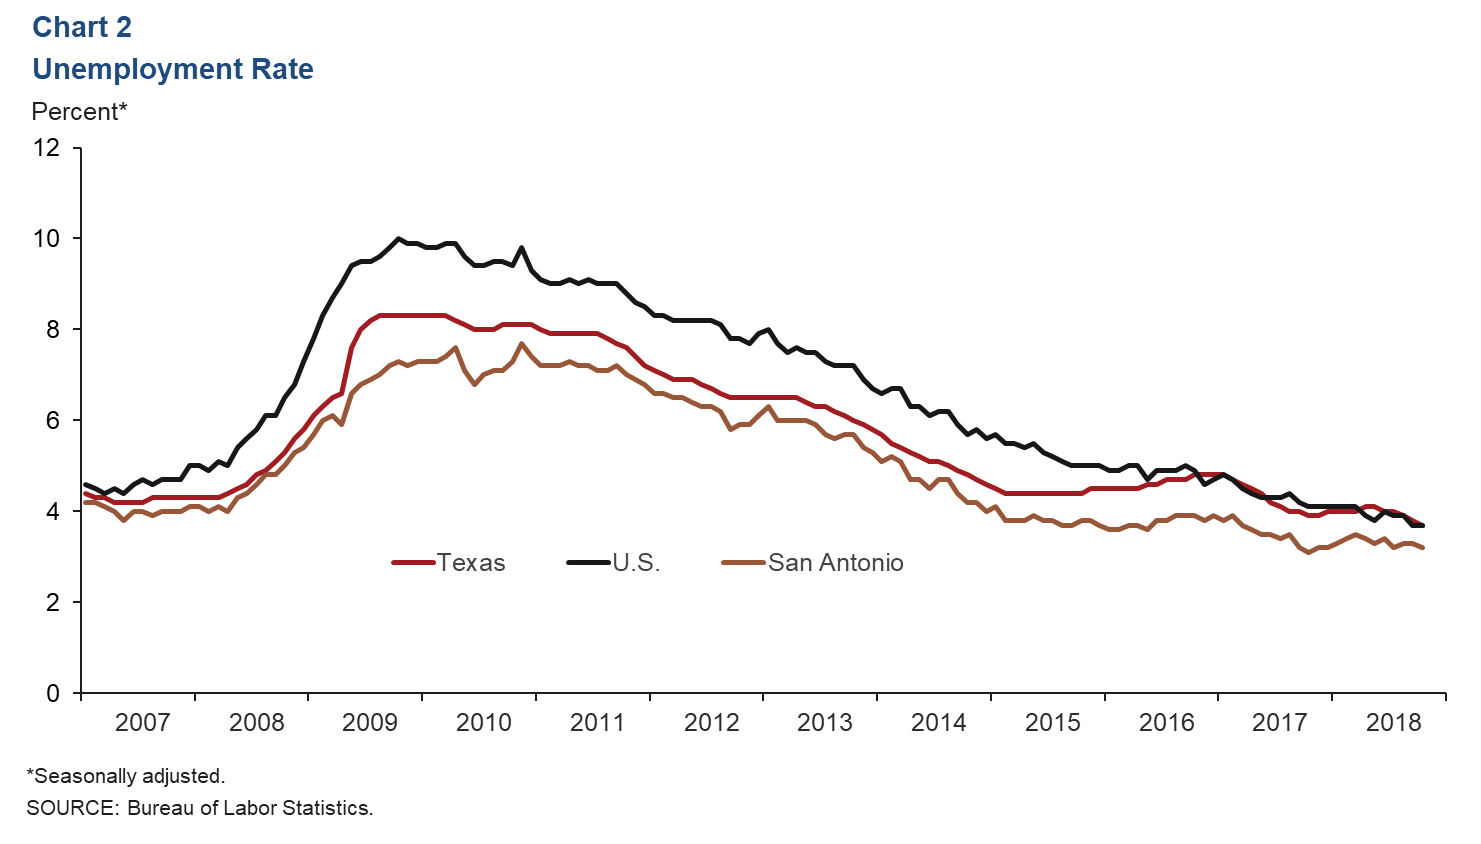
Unemployment Rate Declines
The San Antonio unemployment rate edged down from 3.3 percent to 3.2 percent in October (Chart 2). This was considerably below the state and national rates, both of which were at 3.7 percent. The San Antonio labor force expanded at an annualized rate of 0.6 percent over the first 10 months of the year, compared with growth of 2.9 percent in Texas and 1.7 percent in the U.S.
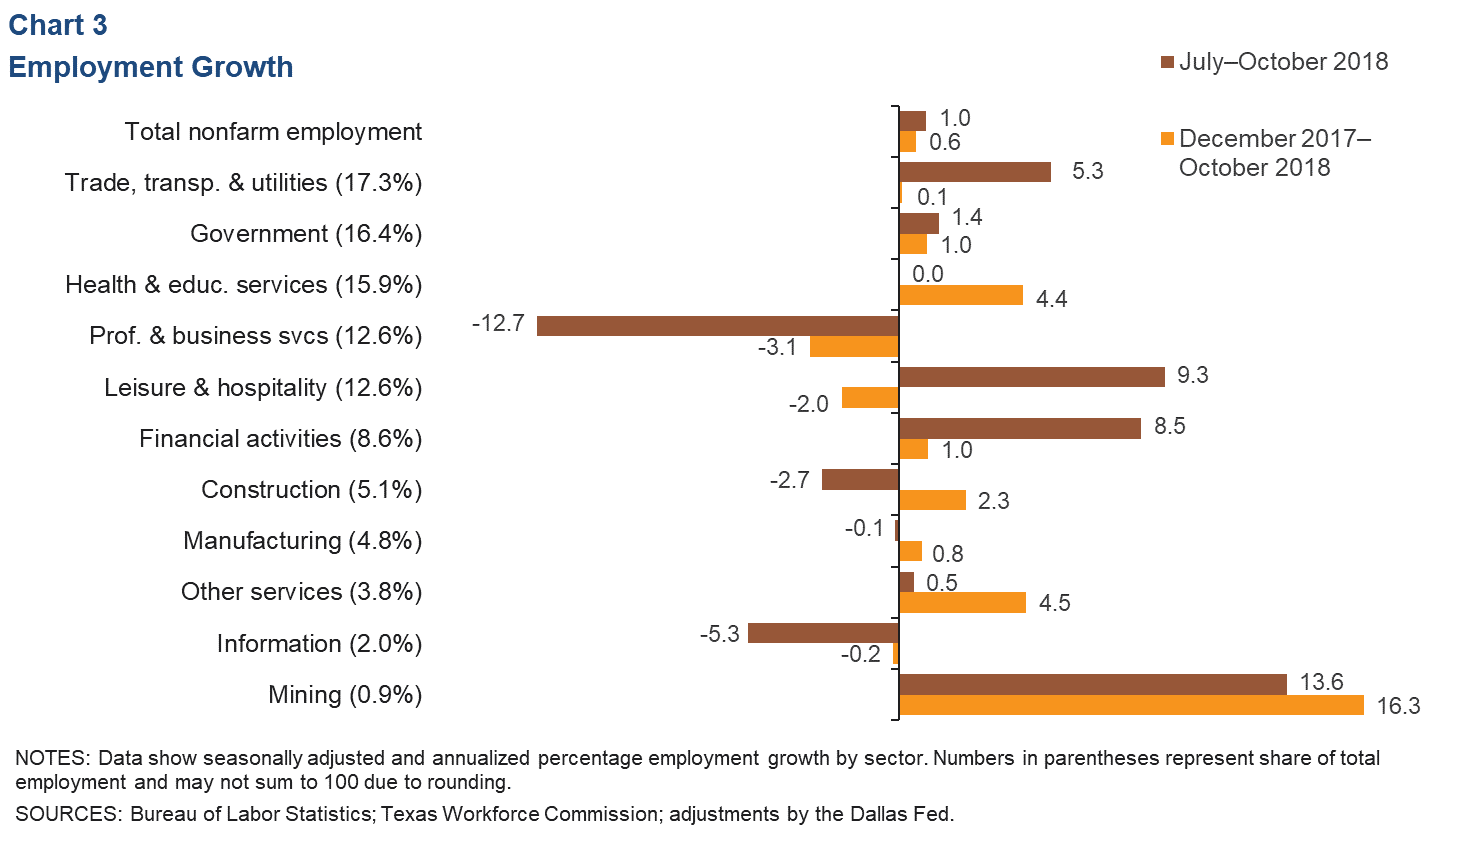
Job Growth Remains Minimal
San Antonio jobs grew at a modest 1 percent annualized rate over the three months through October, slightly above the year-to-date increase of 0.6 percent (Chart 3). Growth by sector was mixed. Mining continued to lead, up 13.6 percent over the past three months. The financial activities sector continued its growth trend since the start of the year, and leisure and hospitality recovered after seeing declines earlier in the year. Professional and business services shed jobs at a rapid pace of 12.7 percent.
Real Estate
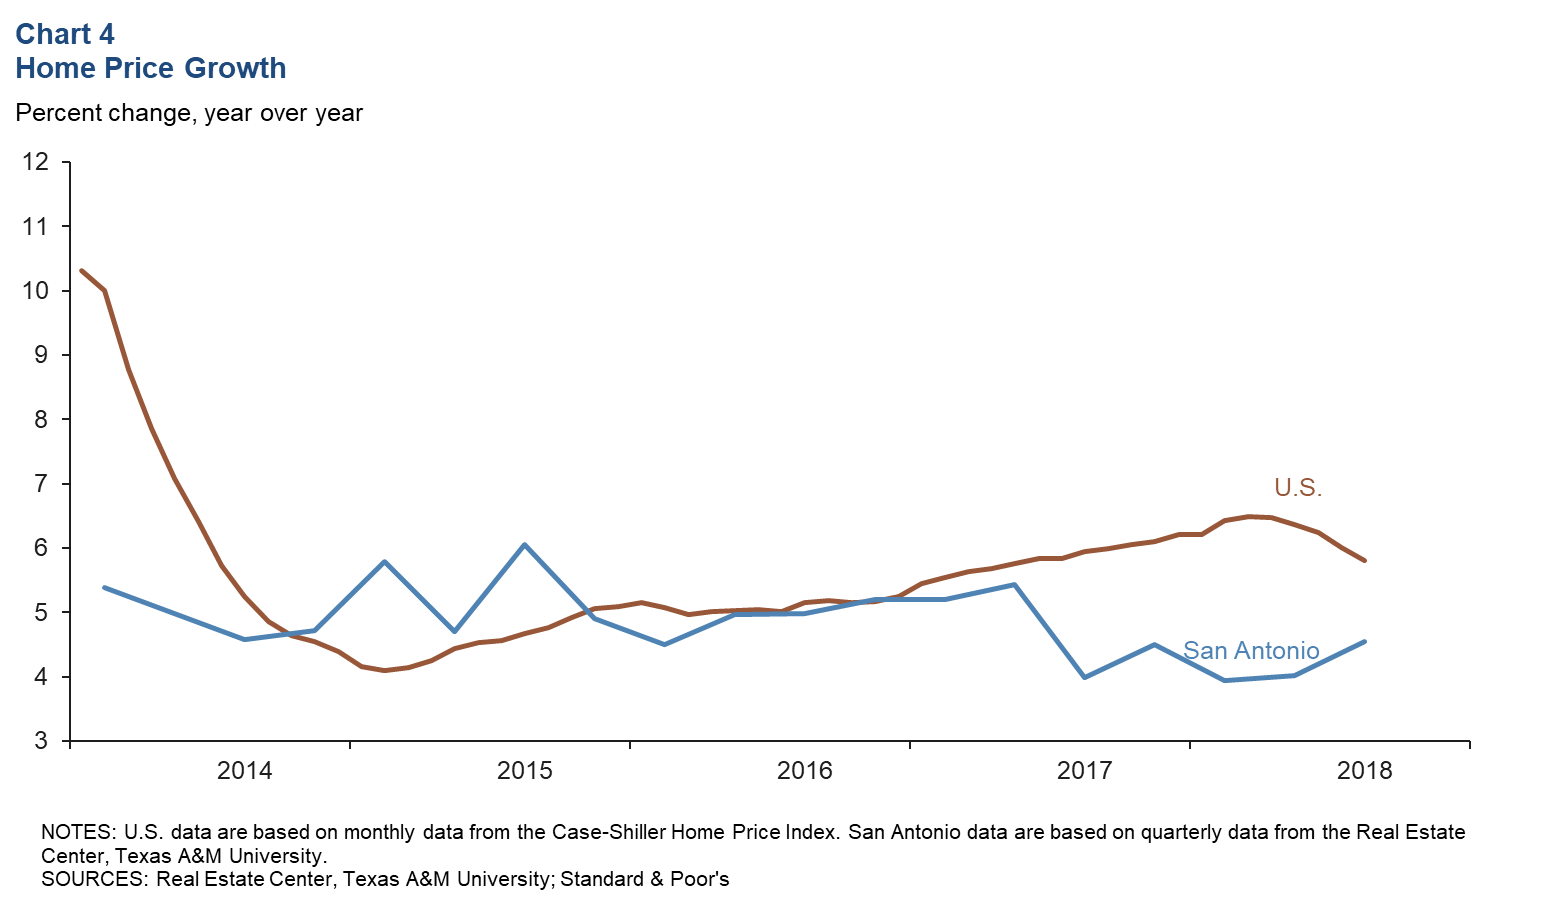
Home Prices Increase
The price of single-family residential homes in San Antonio increased in the third quarter, according to the Texas A&M Real Estate Center's repeat home sales index (Chart 4). On average, housing prices appreciated 4.5 percent year over year. This is slightly below the national rate, which as of August averaged 5.8 percent.
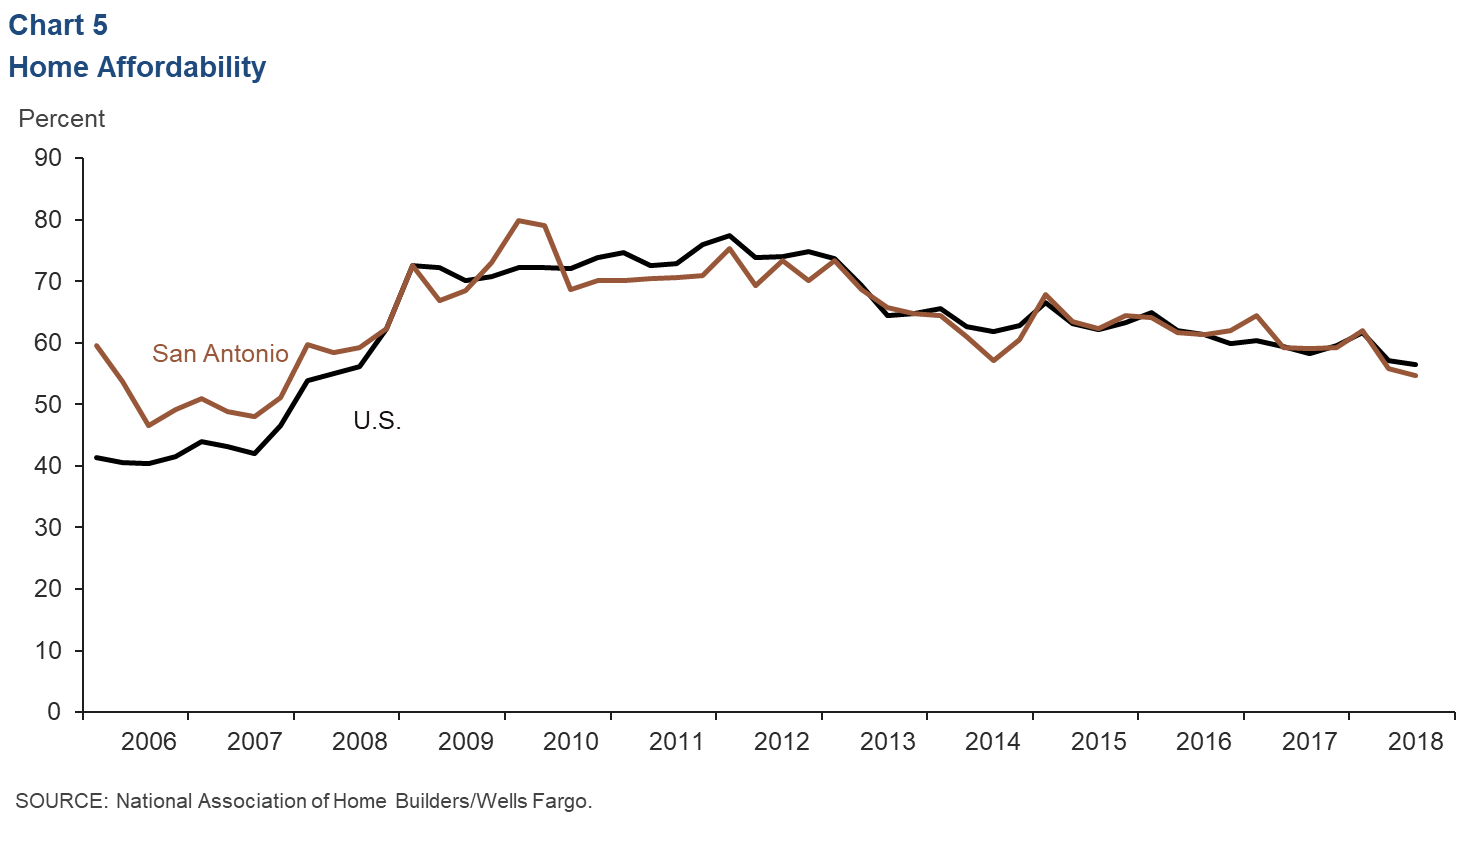
Housing Affordability Falls
San Antonio home affordability has declined as the percentage of homes sold that the median-income household could afford decreased from 55.8 percent in the second quarter to 54.7 percent in the third quarter (Chart 5). A similar trend is seen at the national level, where affordability decreased from 57.1 percent to 56.4 percent over the same period. The median home price in San Antonio as of September was $222,089, slightly below the state and national figures.
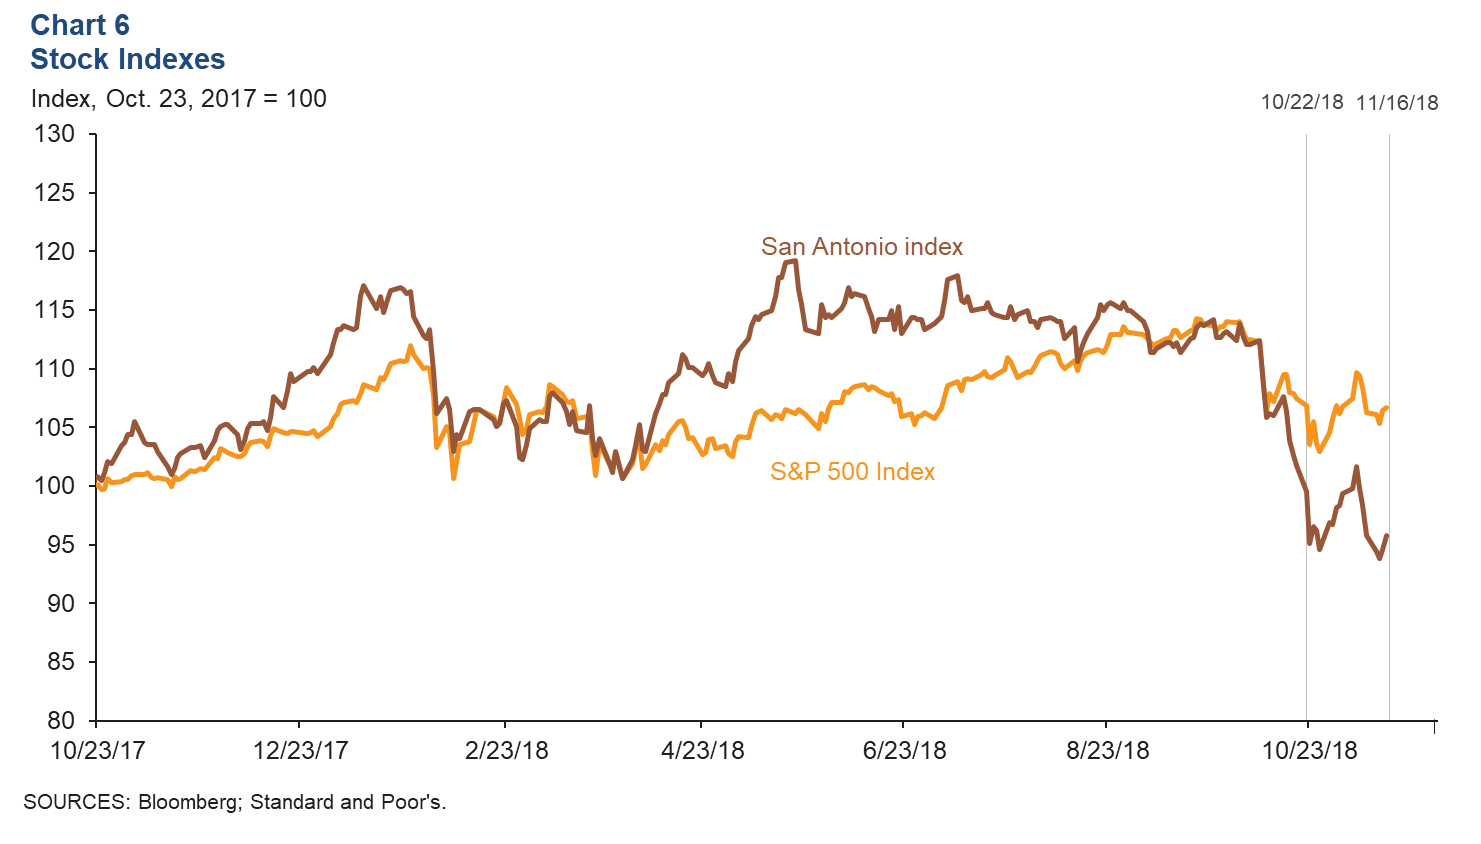
Stock Prices
Stock prices of companies with a significant presence in San Antonio declined 6 percent from Oct. 22 to Nov. 16, while the S&P 500 decreased 0.7 percent (Chart 6). Growth was concentrated in the manufacturing and financial sectors, whereas communication and food service firms saw mild declines. Stocks of companies from the energy sector experienced mixed performances.
NOTE: Data may not match previously published numbers due to revisions.
About San Antonio Economic Indicators
Questions can be addressed to Judy Teng at judy.teng@dal.frb.org. San Antonio Economic Indicators is published every month on the Thursday after state and metro employment data are released.