San Antonio Economic Indicators

The San Antonio economy expanded at a healthy pace in March. The unemployment rate declined to a multiyear low. The San Antonio Business-Cycle Index continued to expand at a rate above the long-term trend. Payrolls accelerated in the first quarter, with strong growth in the construction and leisure and hospitality industries. Private sector wages held steady and real median home prices dipped last month.
Business-Cycle Index
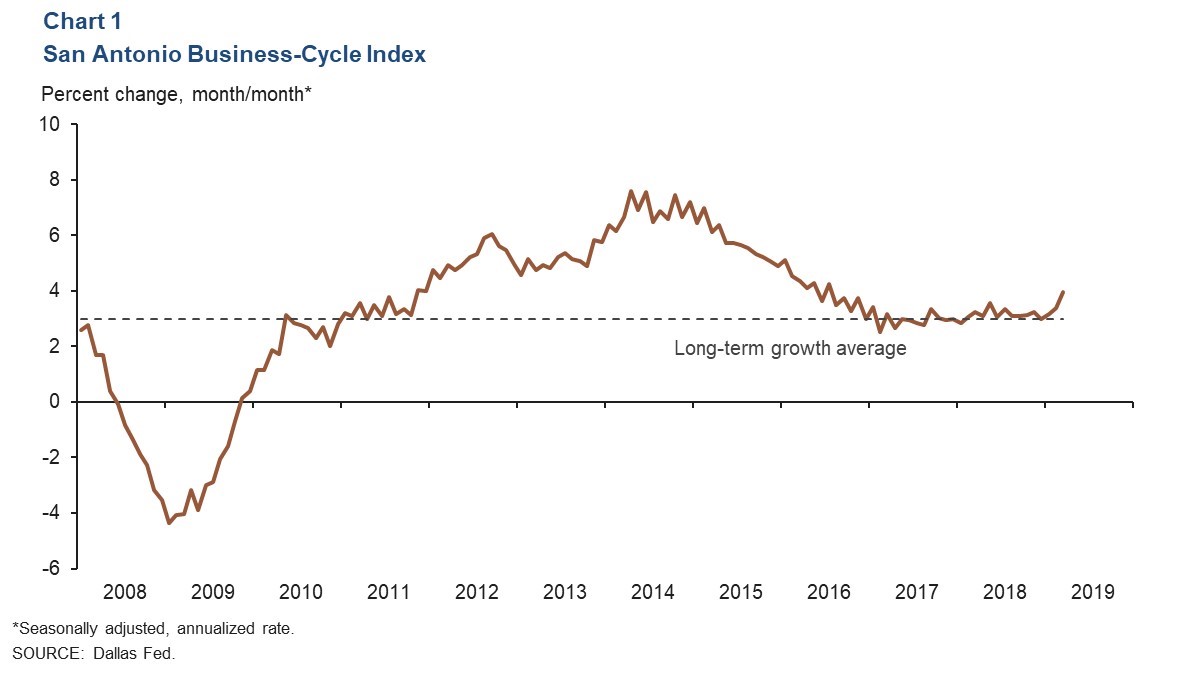
The San Antonio Business-Cycle Index—a broad measure of economic activity—accelerated at an annualized rate of 3.9 percent in March, well above the long-term average of 3.0 percent (Chart 1). The index was propelled by a strong increase in jobs and a fall in the unemployment rate.
Labor Market
Metro’s Unemployment Well Below State’s
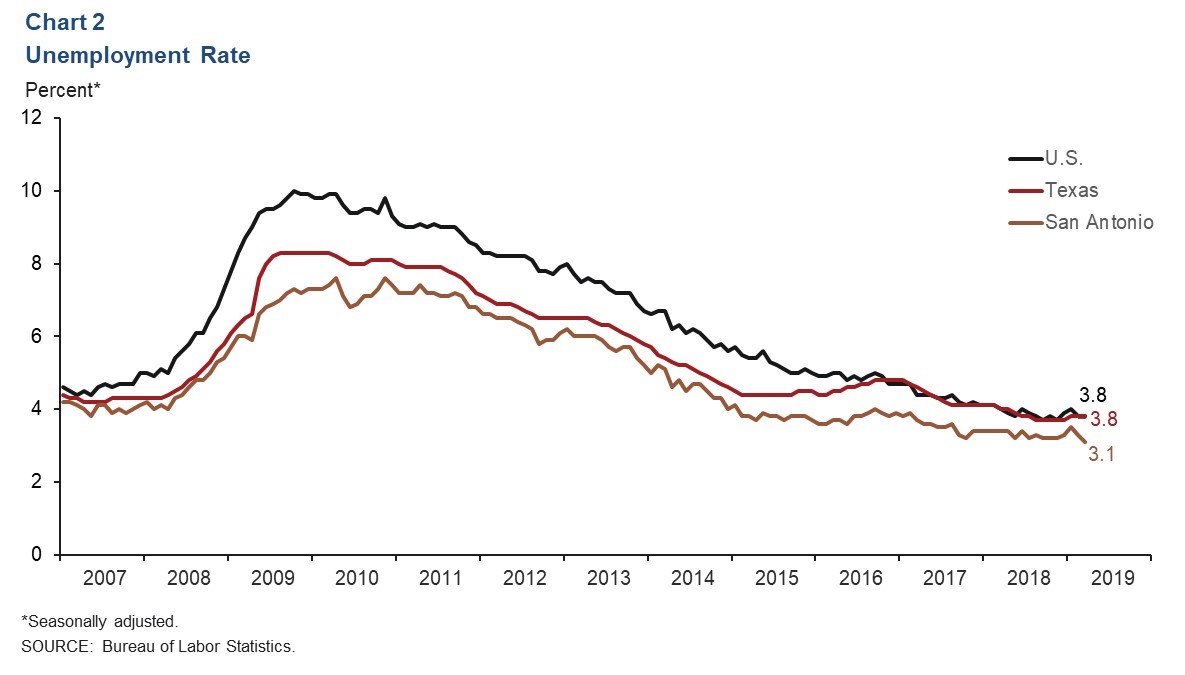
The San Antonio unemployment rate fell to 3.1 percent in March, the lowest reading in 19 years (Chart 2). This is also well below the state and national rates of 3.8 percent, both of which remained unchanged from February. The metro labor force contracted slightly at a 0.4 percent annual rate in March but has increased 1.4 percent through the first three months of the year.
Job Growth Strengthens
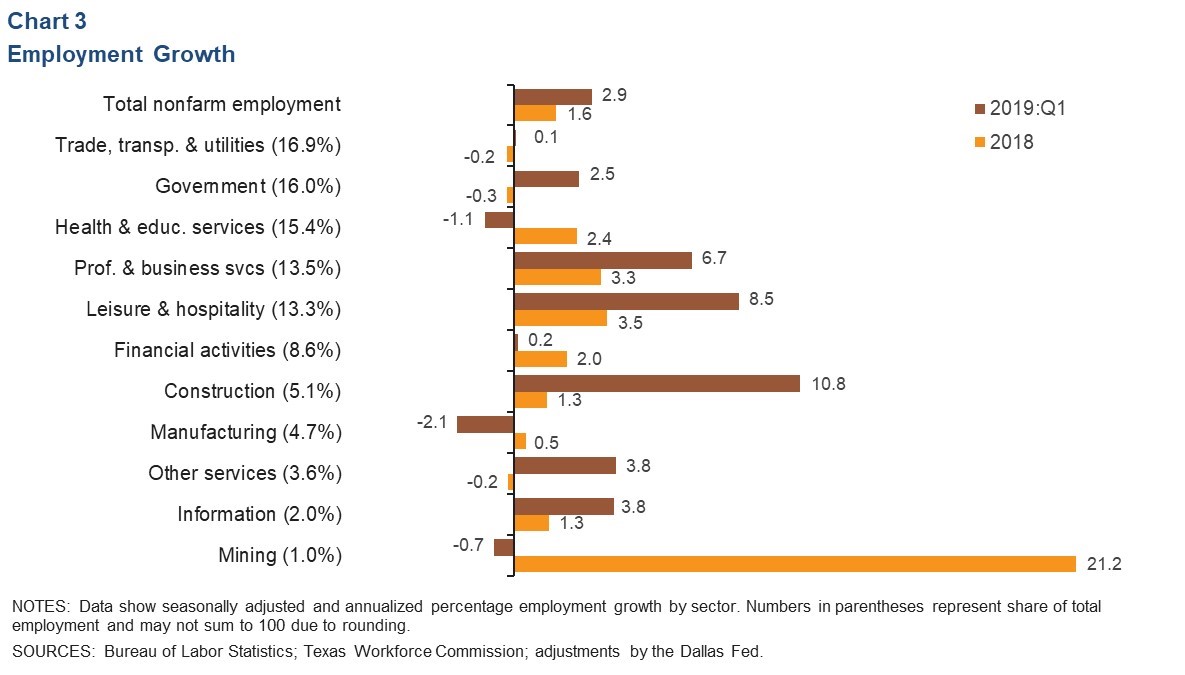
After growing 1.6 percent in 2018, San Antonio jobs expanded at a strong annualized rate of 2.9 percent in the first quarter (Chart 3). Growth across industries was generally positive, with construction leading all sectors at an annualized rate of 10.8 percent, or a net 1,380 jobs. Leisure and hospitality also expanded at a strong annualized rate of 8.5 percent, or a net 2,800 jobs, and was followed by the professional and business services and information industries. Areas of weakness included the manufacturing and health and education services sectors.
Hourly Wages Unchanged
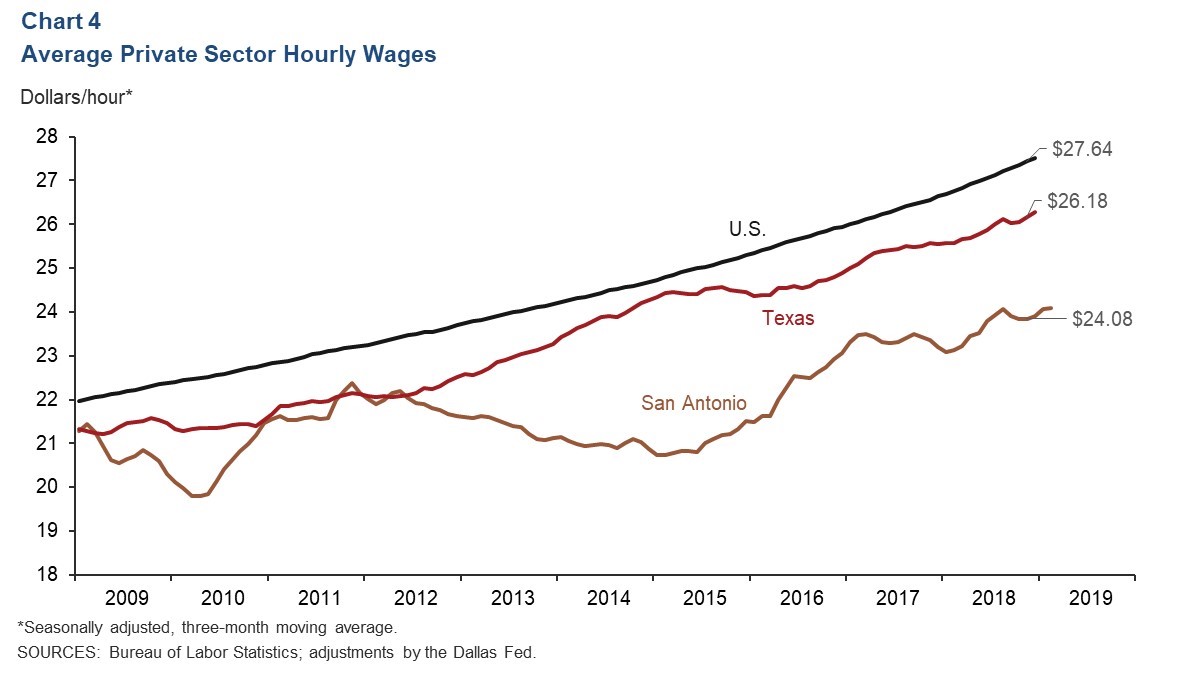
In March, the three-month average for private sector hourly wages in San Antonio stood at $24.08, the same as in February (Chart 4). Year over year, the metro’s wages grew 2.8 percent, well above the state’s 2 percent but below the nation’s 3.2 percent growth.
Real Estate
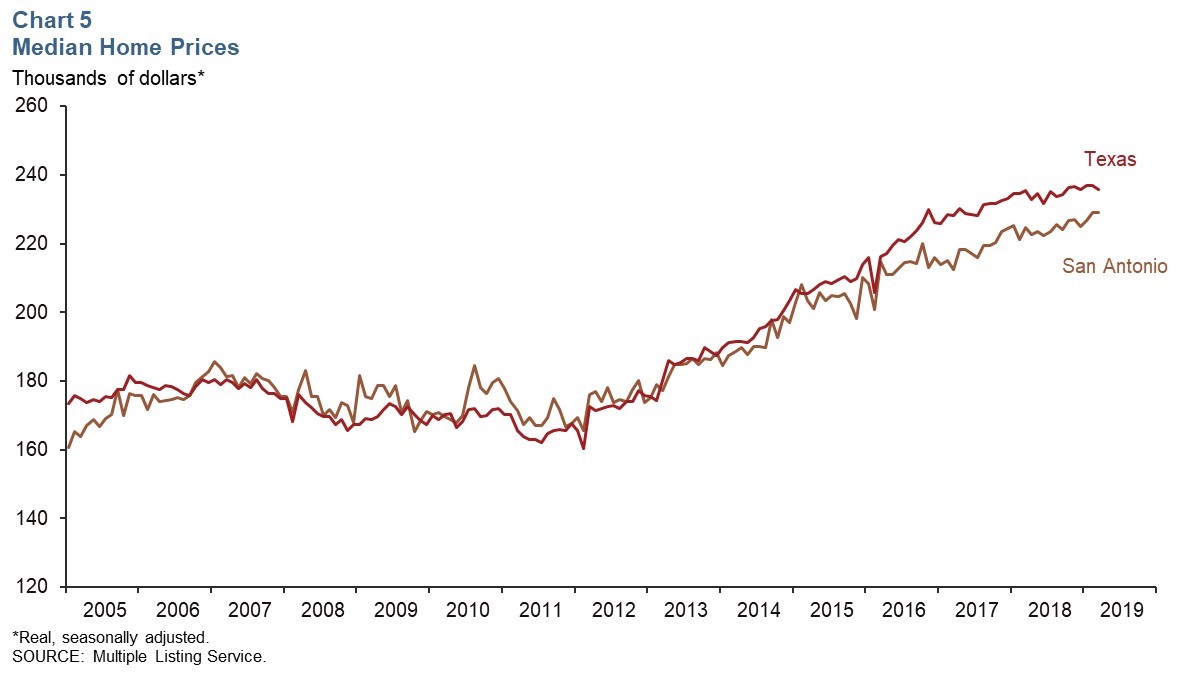
The real median sales price for houses in San Antonio stood at $229,131 in March 2019, down slightly from the previous month (Chart 5). The inflation-adjusted average sales price increased 2.1 percent from first quarter 2018 to first quarter 2019, whereas the state saw no change during this period. Home inventories for the metro remained at 3.6 months of supply, well below the six months considered a balanced market.
Stock Prices
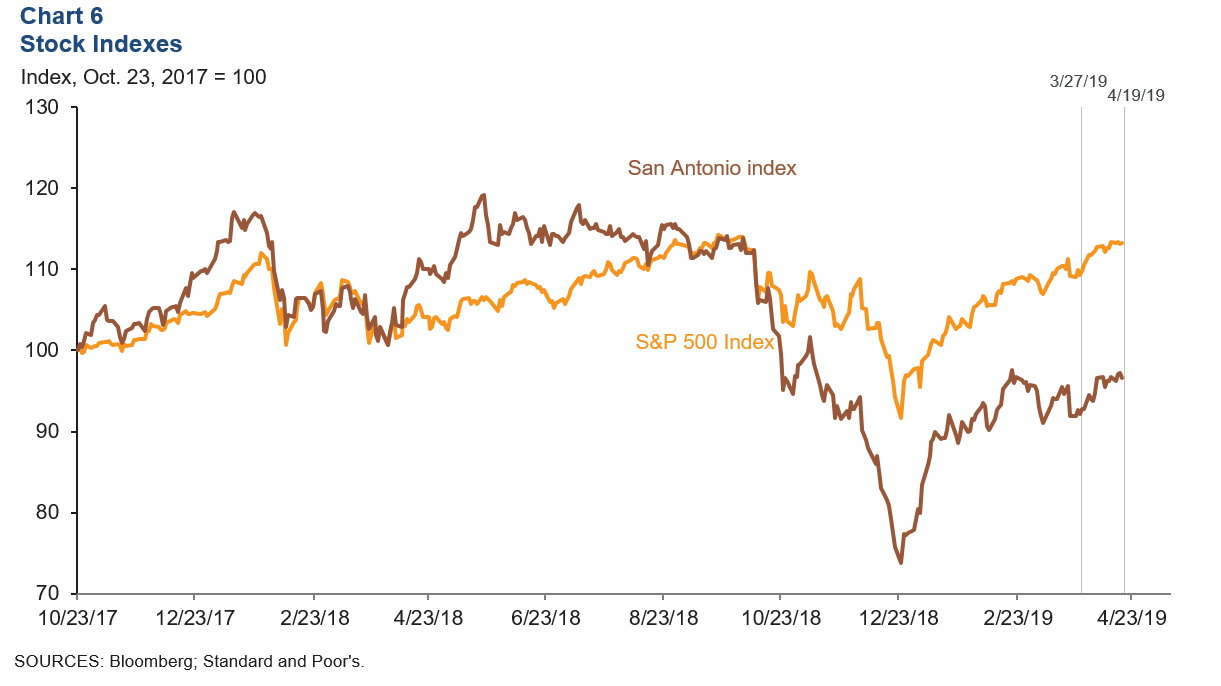
Stock prices of companies with a notable presence in San Antonio increased a healthy 4.8 percent from March 27 to April 19, while the S&P 500 grew a sturdy 3.5 percent (Chart 6). Performance by sector was generally mixed. Companies associated with manufacturing and finance industries saw prices strengthen during this period. Firms in the energy sector had mixed performances. Refining and exploration firms saw strong growth, whereas transportation and pipeline firms experienced little change in stock prices. Communication-related firms also experienced mixed performances, as did those in food services.
NOTE: Data may not match previously published numbers due to revisions.
About San Antonio Economic Indicators
Questions can be addressed to Judy Teng at judy.teng@dal.frb.org. San Antonio Economic Indicators is published every month on the Thursday after state and metro employment data are released.